SparkCode Professional - Dot Charts

Option dialog for Dot Charts.
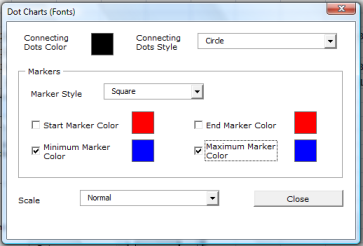
Supported Options
Connecting Dots Color - click the color box to set color for the dots
Connecting Dots Style - the style of the connecting dots on the line, it can be Circle, Square, or Cross
Markers - select the appropriate checkbox to include a Start, End , Minimum or Maximum Marker in the Dot Chart
Marker Style - the style of the markers, can be None, Circle, Square, or Cross.
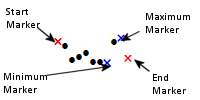
As shown in the image above, the Marker Style (Cross) may be different from the Connecting Dots Style (Circle).
- Start Marker Color - click the color box to set color for the Start marker
- End Marker Color - click the color box to set color for the End marker
- Minimum Marker Color - click the color box to set color for the Minimum marker
- Maximum Marker Color - click the color box to set color for the Maximum marker
Scale - SparkCode offers two scaling modes for dot charts. Normal and User Defined
- Normal - create a sparkline based on the minimum and maximum values of the data series.
- User Defined - create a sparkline that will be scaled within the user defined values. This mode is useful when you need to generate multiple sparklines for several data series using the same scale. If any value in the data series falls outside the user defined range, then SparkCode will default to the Normal mode for scaling.