Creating an Automated Stock Trading System using Microsoft Excel
This a Free training course that shows you how to use the various Stock Trading Technical Indicators to create an Automated Stock Trading System using Microsoft® Excel®. We assume that you have some basic knowledge of Excel and is interested in putting into practice the financial concepts of a technical stock trading system.
We will start from downloading Stock data and move into the calculation of the different Technical Indicators. The Technical Indicators include Moving Average, Directional Movement, Directional Movement Indicator, Average Directional Movement Index and Average True Range. The focus is on two aspects. The first is the understanding of the specific Technical Indicators and the second is the implementation of the indicators in Excel.
Price : Free
Works with Excel 2007-2016
(With all training materials and accompanying workbooks)
See the online training in PDF Format / XPS Format.
Selected Topics from the Training
- Download Stock Trading Prices - Use Excel to download the Stock Trading Prices automatically.
- Moving Average - A moving average reduces the effect short term price volatility. For example, a 10 day simple moving average of the closing price is calculated by averaging the closing price of the last 10 days.
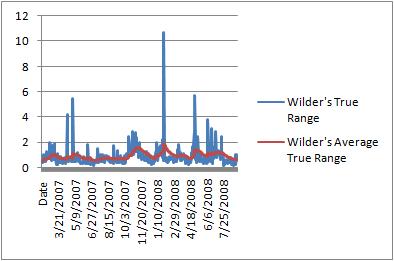
- True Range - The greatest of the the following : Difference between the current High and the current Low, Absolute difference between the current High with the previous Close and Absolute difference between the current Low with the previous Close
- Average Directional Movement Index - Directional Index (DX) is calculated as the ratio of the absolute difference between the values of the two Directional Movement Indicators to the sum of the two Directional Movement Indicators. The Average DX can be calculated using Wilder's Moving Average.