Professional Bond Valuation Spreadsheet Calculator
Price
USD30.00 - Purchase
Includes the Professional Bond Duration and Convexity spreadsheet.
License
Commercial License
System Requirements
Microsoft® Windows 7 or Windows 8, Windows 10
Windows Server 2003, 2008, 2012 or 2016
512 MB RAM
5 MB of Hard Disk space
Excel 2007, 2010, 2013 or 2016
Professional Bond Valuation Spreadsheet Calculator
A bond is a financial instrument issued by the government or corporations when they need to borrow money from the public on a long term basis to finance certain projects. Interest payments called coupons are typically paid out to bond holders on a regular basis while the entire loan amount called the Face or Par value is repaid at the end. The public can purchase a bond to collect the regular interests and hold the bond to the end called the maturity date to collect the principal amount. Otherwise, at any time before the maturity date, the bond holder can choose to sell the bond in the market at a market price.Bonds issued by the government are called treasury bonds while bonds issued by the state or local government are called municipal bonds. Treasury bonds held to the maturity date are typically considered riskless as a government can choose to issue more money if it is unable to repay the coupons or the Face value. There is of course still a possibility that a new government regime may choose not to recognize the bonds issued by the previous government.
The BondValuation.xls spreadsheet is created to value the price of a bond if the bond is sold in the market before the maturity date. The most important factor affecting a bond price is the interest rate. In rising interest rates, bond price will drop while in declining interest rates, bond price will rise.
This spreadsheet also calculates the Yield to Maturity which is the interest rate that the bond holder receives if he holds the bond to maturity. The spreadsheet distinguishes between the Annual Percentage Rate and the Effective Annual Rate. When people talk about yield to maturity, they typically refer to the Annual Percentage Rate. The Effective Annual Rate basically takes into account the effect of compounding interests of the coupons.
Finally, this spreadsheet also illustrates how to plot the US Treasury Bond Yield Curve which is used by many analysts for understanding the current conditions in the financial markets.
Bond Valuation - Yield to Maturity
The Yield to Maturity is a common yardstick that a bond investor uses to measure the value of a bond. It is basically the rate of return, sometimes referred to the internal rate of return, when a bond is held to maturity. In simple words, it is the interest rate you will receive if you hold the bonds to the maturity date without selling it in the market. The Yield to Maturity is calculated in the Bond Valuation-Yield worksheet.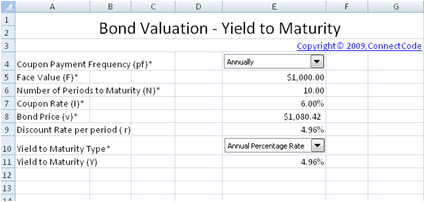
Input Values
- Coupon Payment Frequency (pf) - Whether the coupon is paid annually or semi-annually. The coupon rate is typically stated in an annual percentage. Thus if a coupon is paid out semi-annually, the coupon payments is equivalent to : (Coupon Rate / 2) * Face Value of the Bond
- Face Value (F) - The principal or loan amount of the bond to be repaid at the end of the maturity period.
- Number of Periods to Maturity (N) - This field is related to the Coupon Payment Frequency. If Coupon Payment Frequency is set to Semi-Annually, Number of Periods means number of Half-year period. If Coupon Payment Frequency is set to Annually, then Number of Periods means number of One-year period. This field is used in the calculation of the Bond's Yield to Maturity.
- Coupon Rate (I) - This is the stated annual interest rate payments for a Bond. This interest rate multiply with the Face value gives the periodic coupon payments.
- Bond Price (v) - The current price of the bond in the market. Bond prices fluctuates due to changes in interest rates and the price that the bond is purchased affects the Yield to Maturity.
- Yield to Maturity Type - This Bond Valuation spreadsheet distinguishes between the Annual Percentage Rate and the Effective Annual Rate. When people talk about yield to maturity, they typically refer to the Annual Percentage Rate. The Effective Annual Rate basically takes into account the effect of compounding interests of the coupons.
Output Values
- Discount Rate per period (r) - Yield to Maturity is typically quoted like an Annual Percentage Rate. This discount rate is the exact rate per period. For example, if the Coupon Payment Frequency is semi-annually, then this discount rate is the rate per six months.
- Yield to Maturity (Y) - The interest rate received if a bond is held to the maturity date.
US Treasury Bond Yield Curve
This worksheet plots the Yield Curve of the US Treasury Bonds. The Yield Curve is a chart showing the relationship between the Time to Maturity versus the Yield to Maturity. It is typically used by analysts to understand the conditions in the financial markets and the economy.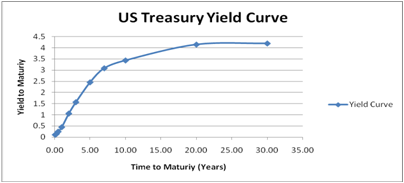
The Time to Maturity supported is listed below:
- 1 Month
- 3 Months
- 6 Months
- 1 Year
- 2 Years
- 3 Years
- 5 Years
- 7 Years
- 10 Years
- 20 Years
- 30 Years
https://www.ustreas.gov/offices/domestic-finance/debt-management/interest-rate/yield.shtml
Bond Valuation - Bond Price
The Bond Valuation-Price worksheet uses the same fields as the Yield to Maturity worksheet. It values the price of a bond based on the Yield to Maturity.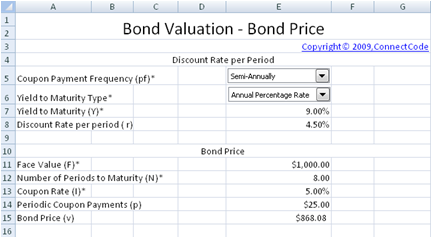
Input Values
- Coupon Payment Frequency (pf) - Whether the coupon is paid annually or semi-annually. The coupon rate is typically stated in an annual percentage. Thus if a coupon is paid out semi-annually, the coupon payments is equivalent to : (Coupon Rate / 2) * Face Value of the Bond
- Yield to Maturity Type - The spreadsheet distinguishes between the Annual Percentage Rate and the Effective Annual Rate. When people talk about yield to maturity, they typically refer to the Annual Percentage Rate. The Effective Annual Rate basically takes into account the effect of compounding interests of the coupons.
- Yield to Maturity (Y) - The interest rate received if a bond is held to the maturity date.
- Face Value (F) - The principal or loan amount of the bond to be repaid at the end of the maturity period.
- Number of Periods to Maturity (N) - This field is related to the Coupon Payment Frequency. If Coupon Payment Frequency is set to Semi-Annually, Number of Periods means number of Half-year period. If Coupon Payment Frequency is set to Annually, then Number of Periods means number of One-year period. This field is used in the calculation of the bond price.
- Coupon Rate (I) - This is the stated annual interest rate payments for a Bond. This interest rate multiply with the Face value gives the periodic coupon payments.
Output Values
- Discount Rate per period (r) - Yield to Maturity is typically quoted like an Annual Percentage Rate. This discount rate is the exact rate per period. For example, if the Coupon Payment Frequency is set to Semi-Annually, then this discount rate is the rate per six months.
- Bond Price (v) - The current valued price of the bond in the market.
Sensitivity Analysis
This Bond Vaulation-Price worksheet also uses Excel Data Table to perform sensitivity analysis on the bond price by varying the Yield to Maturity. A data table is a range of cells that shows how changing one or two variables in your formulas can affect the results of those formulas. Simply key in different Yield to Maturity in the table to see how it affects on the Bond Price.
Customizing the Bond Valuation spreadsheet
Bond Valuation-Yield - Coupon Payment Frequency (pf) field
The Coupon Payments Frequency field is defined using a control. The control's Input Range(in the Format Control->Control properties) is set to list the following selections. The selections are listed in the Internal worksheet of the spreadsheet.| Annually |
| Semi-Annually |
When a selection is made, the control will return a number to the cell below the control. The number returned is used for calculating the Discount Rate per period.
| Coupon Payments Frequency | Number to return |
| Annually | 1 |
| Semi-Annually | 2 |
Note : This field also appears in the Bond Valuation-Price worksheet.
Bond Valuation-Yield -Yield to Maturity Type field
The Yield to Maturity Type field is also defined using a control. The control is set to list the following selections in the Internal worksheet.| Annual Percentage Rate |
| Effective Annual Rate |
When a selection is made, the control will return a number to the cell below the control. The number returned is used for calculating the Yield to Maturity.
| Yield to Maturity Type | Number to return |
| Annual Percentage Rate | 1 |
| Effective Annual Rate | 2 |
Note : This field also appears in the Bond Valuation-Price worksheet. In this case, it is used for calculating the Bond Price.
Bond Valuation-Yield -Discount Rate per Period field
This field uses Excel's RATE formula which returns the interest rate per period of an annuity. The RATE formula is defined as follow :RATE(nper,pmt,pv,fv,type,guess)
nper is the number of payment periods in an annuity, pmt is the payment made during each period of the annuity, pv is the present value which is the current bond price and fv is the future value which is the Face value of the bond. type and guess is not used in our calculation.
The actual Discount Rate per Period is calculated as follows :
RATE(Number of Periods to Maturity,Periodic Coupon Payments,-Current Bond Price,Face value of the Bond)
Bond Valuation-Yield - Yield to Maturity field
The Yield to Maturity field uses the Discount Rate per Period field. When Yield to Maturity is calculated as the Annual Percentage Rate, it is simply the Discount Rate per Period multiply with the Coupon Payment Frequency. This is basically the discount rate per annum.When the Effective Annual Rate is required, the following formula is used.
EXP(Coupon Payment Frequency*LN(Discount Rate per Period+1))-1
EXP - Exponent function
LN - Natural Logarithm function
Bond Valuation-Price - Bond Price field
The Bond Price is calculated as the sum of the Present Value of the coupons and the Present Value of the Bond's Face value. The coupon payments can be thought of as an annuity discounted using the Time Value of Money concepts. The Present Value of the Bond's Face Value is also calculated by discounting the Face Value using the Time value of Money concepts.The Bond Price is calculated using Excel's PV (present value) formula. The formula is defined as follows:
PV(rate,nper,pmt,fv,type)
rate is the interest rate per period, nper is the number of payment periods of an annuity, pmt is the payment during each period of the annuity, fv is the future value, which is the Face value of the bond and type is not used in our calculation.
The actual Bond Price is calculated as follow :
PV(Discount Rate per Period,Number of Periods to Maturity,-Periodic Coupon Payments,-Face Value)
Bond Valuation-Price: Sensitivity Analysis
This Bond Valuation-Price worksheet uses Excel Data Table to perform sensitivity analysis on the bond price by varying the Yield to Maturity. To create the Data Table, cell B21 is first defined as the formula of the Bond Price which is exactly the same as cell E15.The following steps are then carried out to create the Data Table in this worksheet.
1. Select the range B20 to G21.
2. On the Data tab, in the Data Tools group, click What-If Analysis, and then click Data Table.
3. Set the Row input cell to E7.
Similar steps are used to create the second Data Table in the worksheet.