Free Portfolio Optimization
Background
In 1952, Harry Markowitz published a paper on portfolio selection and the effects of diversification on security returns. His works have a great impact on modern finance and have led to the development of the Capital Asset Pricing Model by William Sharpe, Linter and Mossin.In the Portfolio Risk spreadsheet, we have developed a model to calculate the Returns, Mean, Variance and Standard Deviation of a Portfolio based on historical prices. The calculation allows us to see the effects of diversification in the Portfolio. We are taking a step further in this Portfolio Optimization spreadsheet by optimizing the allocation of the assets in the portfolio using Markowitz theory.
We will start with a worksheet that models the Risk Reward Trade Off Line followed by by a worksheet that models Portfolio Optimization of 2 Assets. With these two worksheets as a basis, we will use the Microsoft Excel Solver to model the complex Portfolio Optimization of more than 2 assets. Finally we will integrate our portfolio optimization model with stock prices downloaded from https://finance.yahoo.com. A regression of the historical prices will be performed automatically and the output average returns, correlations, variances and covariances will be used for the portfolio optimization model.
Risk Reward Trade Off Line
The basic principle of the Risk Reward Trade Off Line is the more risk you take, the higher your reward. Of course, the flip side is the possibility of you losing more money. Markowitz theory allows us to vary the amount of risk we undertake in the hope of achieving the returns we expected. The basic concept is to build a portfolio which consists of a normal asset like a stock or a bond with another Riskless Asset like the U.S Treasury Bills. By varying the proportion of each asset, it allows us to vary the amount of risk we wish to undertake vs the returns we hope to achieve.Risk Reward Trade Off Line Spreadsheet
The model in the "PortfolioRiskRewardTradeOffLine" worksheet allows us to combine the normal asset and a Riskless asset to model the Risk Reward Trade Off Line.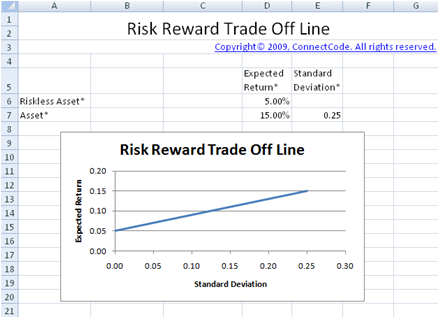
Inputs
- Expected Return Riskless Asset - This can be the published rate of a U.S Treasury Bill or an assumed riskless rate.
- Standard Deviation of Riskless Asset - This is assumed to be zero as the asset is considered riskless.
- Expected Return of Asset - This can be estimated by using historical prices of the asset or an assumed expected return.
- Standard Deviation of Asset - This can be estimated by calculating the standard deviation of the asset from historical prices and assumed standard deviation.
Outputs
The worksheet uses the Portfolio theory to calculate the expected return of the portfolio using the following formula:Expected Return of Portfolio = Weight of normal asset * Expected Return of normal asset + Weight of Riskless asset + Expected Return of Riskless asset.
The standard deviation of the portfolio is the proportion of total assets invested in the risky asset multiply by the standard deviation of the risky asset. This is because the standard deviation of the riskless asset is considered to be zero.
Risk Reward Trade Off Line
The graph shows the different proportion of the normal and Riskless asset. It is simple to see that by investing proportionately more on the normal asset, it may allow us to achieve more returns but at the same time will subject us to more risks. Thus the risk appetite of the investor will determine the various proportions of the portfolio to use.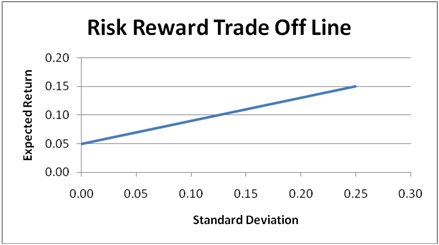
Correlations of Assets
One of the basic aspects of building a portfolio is to include assets which are negatively or have a small positive correlation with each other. When the assets in a portfolio do not move in the same direction, it is thought to be safer as they do not fluctuate as much. In the next few sections, we will see correlation between the different assets to be an assumed number or calculated from the regression of historical asset prices.Portfolio Optimization (2 Assets)
In the "PortfolioOptimization2Assets" worksheet, we will use Markowitz theory to optimize the proportions of the 2 normal risky assets and the riskless asset in the portfolio. By optimizing the portfolio, we will have a portfolio that is considered as an efficient portfolio.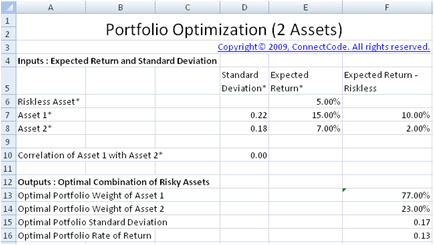
Efficient Portfolio
A efficient portfolio is one that combines the different assets to provide the highest level of expected return while undertaking the lowest level of risk.Efficient Frontier
The graph below shows the attainable set of portfolios by combining the different risky assets as dark dots. From the point X to the point Y in the blue curve, it allows us to achieve highest level of return with the minimal risk we have to undertake. This set of portfolios is known as the efficient frontier. The efficient frontier has been proven to be a hyperbola curve when expected return is plotted against standard deviation.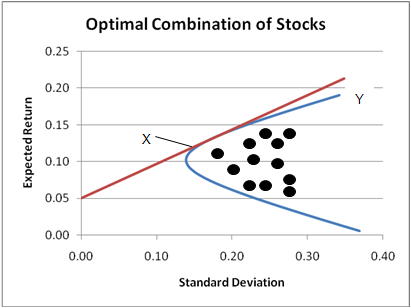
Tangency Portfolio
The Tangency Portfolio is a portfolio that is on the efficient frontier with the highest return minus risk free rate over risk. In other words, it is the portfolio with the highest Sharpe ratio.Inputs
- Expected Return of Riskless Asset - This can be determined from the U.S Treasury Bills or Bonds. The standard deviation of the Riskless asset is not required as this asset is considered riskless.
- Expected Return of Asset 1 - This can be estimated by using historical prices of the asset.
- Expected Return of Asset 2 - This can be estimated by using historical prices of the asset.
- Standard Deviation of Asset 1 - This can be estimated by calculating the standard deviation of the asset from historical prices.
- Standard Deviation of Asset 2 - This can be estimated by calculating the standard deviation of the asset from historical prices.
- Correlation of Asset 1 with Asset 2 - You can use the AssetsCorrelations spreadsheet to determine the correlation of the two assets using historical prices. Or enter an assumed correlation between the two assets.
Outputs
The following four fields are the most important output of this worksheet model. They are the weights of the two different assets that give us the optimal portfolio based on Markowitz theory. The Standard Deviation and the expected Rate of Return are also calculated.- Optimal Portfolio Weight of Asset 1
- Optimal Portfolio Weight of Asset 2
- Optimal Portfolio Standard Deviation
- Optimal Portfolio Rate of Return
Usage of Optimal Portfolio
This section of the worksheet allows you to enter the amount to invest and it will use the Optimal Portfolio weights to calculate the amount to invest in the Riskless Asset, Asset 1 and Asset 2. By entering the Expected Rate of Return, it uses the Risk Reward Trade Off Line to vary the proportion of the Portfolio of normal assets and Riskless Asset.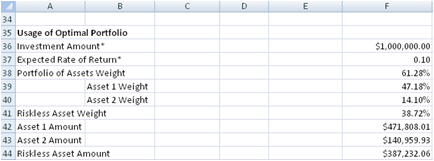
Optimal Combination of Risky Assets Curve
The optimal combination of risky assets curve is plotted using the following fields by varying the weights in Asset 1 and 2 and calculating the Standard Deviation and Expected Return.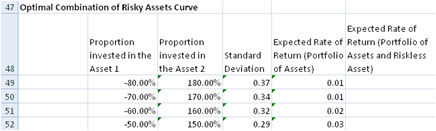
- Proportion invested in the Asset 1 - This field contains the varying weights of Asset 1.
- Proportion invested in the Asset 2 - This field contains the varying weights of Asset 2.
- Standard Deviation - Standard Deviation of the portfolio with the varying weights of Asset 1 and 2.
- Expected Rate of Return (Portfolio of Assets) - Expected Rate of Return of the portfolio with the varying weights of Asset 1 and 2.
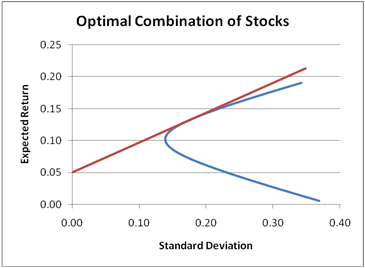
Efficient Trade Off Line
The Efficient Trade Off Line shows the different proportion of the normal and Riskless assets. The following field is added to the curve in the previous section.- Expected Rate of Return (Portfolio of Assets and Riskless Asset)
Download Free Portfolio Optimization spreadsheet - v1.2
System RequirementsMicrosoft® Windows 7, Windows 8 or Windows 10
Windows Server 2003, 2008, 2012 or 2916
512 MB RAM
5 MB of Hard Disk space
Excel 2007, 2010, 2013 or 2016
License
By downloading this software from our web site, you agree to the terms of our license agreement.
Download
FreePortfolioOptimization.zip (Zip Format - 112 KB)
Get the Professional version
Joeri D.
Benefits
- Includes the Portfolio Optimization for 7 Assets spreadsheet
- Allows customization of the Portfolio Optimization spreadsheet for any number of assets
- Includes the Automatic Regression of Stock Prices for Portfolio Optimization spreadsheet
- Unlocked
- Allows removal of copyright message in the template
- Allows commercial use within the company
- Allows customization of the model
- Full source code
Limited Time Bonus
- Free Visual Basic for Applications Training worth USD$30 (Over 100 pages!)
- Modern Portfolio Risks spreadsheet
USD69.00 - Purchase (For a limited time, get it Free. Click on the Details page above to find out how.)