Capital Budgeting Spreadsheet
Capital Budgeting Spreadsheet
Capital Budgeting is the process of analyzing a company's investment decisions such as investing in new equipments, machineries, plants, projects and products. This process involves the estimation of the expected cash flows, the calculation of the Net Present Value (NPV) and the calculation of the Internal Rate of Return (IRR) of the investment. Net Present Value is defined as the present value of all cash inflows minus the present value of all cash outflows. If NPV is positive, the investment is making money and is thus viable. Internal Rate of Return is defined as the discount rate that makes the Net Present Value zero. If the IRR is greater than the opportunity cost of capital then the investment is feasible. The greater the value the IRR, the more feasible an investment is.
Price - USD69.00
There are two hurdles in this analyzing process. One involves the correct estimation of the expected cash flow. The other is the use of a correct discount rate (also known as the Project Cost of Capital). In some cases, it is possible to simply use the Company' Weighted Average Cost of Capital (WACC) as the Project Cost of Capital. This is especially the case if the project has similar cost structure as the company. In other cases, a separate estimation or assumption of the Project Cost of Capital is required.
This Capital Budgeting spreadsheet aims to assist investors, managers or analysts in correctly estimating the cash flow in different scenarios and accurately calculating the Net Present Value and Internal Rate of Return. It also allows different investment projects cash flow to be compared and the forecasting of base case, worst case and best case scenario.
Priority Technical Support, Free upgrades for a year
ConnectCode provides excellent priority email support to our registered customers. Customers are also entitled to a one year free upgrade of the software.System Requirements
Microsoft® Windows 7, Windows 8 or Windows 10Windows Server 2003, 2008, 2012, 2016
512 MB RAM
5 MB of Hard Disk space
Excel 2007, 2010, 2013 or 2016
Benefits
- Unlocked
- Allows removal of copyright message in the template
- Allows commercial use within the company
- Allows full customization of the model
- Worksheet for estimating Cash Flow before and after a Project Investment
- Worksheet for Scenario Analysis. Forecast for Base Case, Worst Case and Best Case
Bonus
- Includes the Professional Inflation and Consumer Price Index Calculator Spreadsheet
- Includes the Professional Weighted Average Cost of Capital (WACC) Calculator Spreadsheet
Calculating the NPV and IRR of a Project Investment
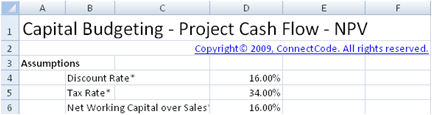
The CapitalBudgeting-ProjectCashFlow-NPV worksheet in the Capital Budgeting spreadsheet allows you to key in the assumptions and estimates of a project cash flow and will calculate the Net Present Value and Internal Rate of Return of the investment.Assumptions
This worksheet performs capital budgeting analysis by making three basic assumptions. The assumptions are the Discount Rate to use in the investment project, the company's Tax Rate and the estimated percentage of Net Working Capital over Sales.
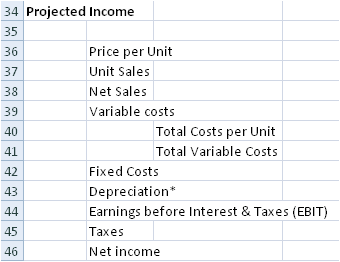
Projected Income
The net income of the project is calculated by using the following formula:
Net income = Earnings before Interest & Taxes (EBIT) - Taxes
where
EBIT = Net Sales - Total Variable Costs - Total Fixed Costs - Depreciation

Projected Cash Flows
This section is where the estimated cash flows are calculated. The Operating cash flow is defined as follows:
Operating cash flow = EBIT + Depreaciation + Taxes
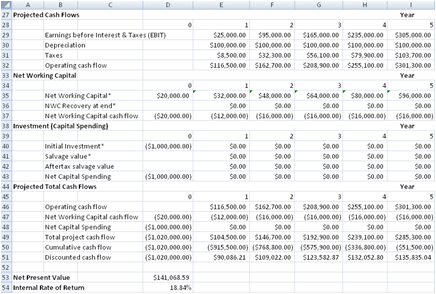
Net Working Capital
The Net Working Capital at Year 0 can be entered directly into the spreadsheet. From Year 1 onwards, it is calculated as as function over Net Sales as follows:
Net Working Capital = Net Working Capital over Sales * Net Sales
Net Working Capital cash flow is calculated as follows:
Net Working Capital cash flow = -(Current Year Net Working Capital - Previous Year Net Working Capital) + NWC Recovery at end
Investment (Capital Spending)
The project investment and salvage value are taken into account in this section.
Aftertax salvage value is calculated as follows:
Aftertax salvage value = Salvage value * (1 - Tax Rate)
Net Capital Spending is calculated as follows:
Net Capital Spending = Initial Investment + Aftertax salvage value
Project Total Cash Flow
The Discounted cash flow uses the Time Value of Money to discount the Total project cash flow with the assumed Discount Rate. Total project cash flow is calculated as follows:
Total project cash flow = Operating cash flow + Net Working Capital cash flow + Net Capital Spending
Net Present Value and Internal Rate of Return
Net Present Value is calculated using Excel's NPV function on the Total project cash flow. Internal Rate of Return is calculated using Excel's IRR function on the Total project cash flow.
Comparing the Cash flow before and after an Investment
This worksheet expands on the previous worksheet and allows you to estimate and compare the cash flows before and after an investment. In a new investment project that leads to the production of higher value products or lower overall costs, it is the cash flow differences instead of the cash flow of the new project that is important in the decision making process. The Net Present Value and Internal Rate of Return in this worksheet are calculated based on the cash flow difference due to the investment. This will allow decisions to be made on whether to invest in the new project or to stay status quo.Before Investment
The worksheet allows the inputs in the Before Investment section and After Investment section to be entered. The different sections are used for calculating the difference in cash flow before and after the investments.
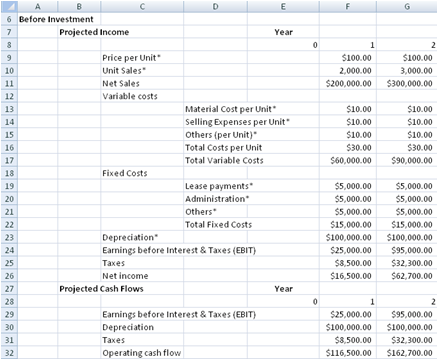
Projected Income
The net income of the project is calculated by using the following formula:
Net income = Earnings before Interest & Taxes (EBIT) - Taxes
where
EBIT = Net Sales - Total Variable Costs - Total Fixed Costs - Depreciation
Projected Cash Flow
This section is where the estimated cash flows are calculated. The Operating cash flow is defined as follows:
Operating cash flow = EBIT + Depreciation + Taxes
After Investment
This section is a replicate of the Before Investment section. It is used for keying in the inputs of the cash flow after the investment is made.
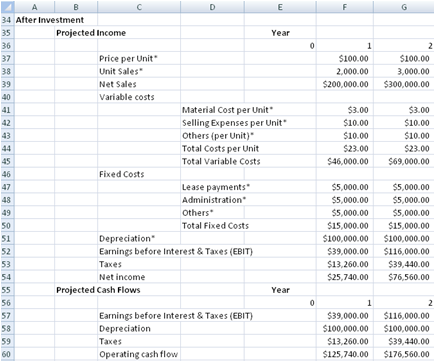
Investment (Capital Spending)
The project investment and salvage value is taken into account in this section.
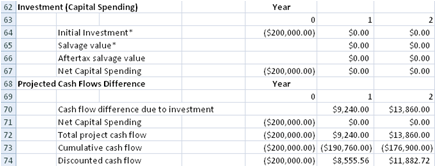
Aftertax salvage value is calculated as follows:
Aftertax salvage value = Salvage value * (1 - Tax Rate)
Net Capital Spending is calculated as follows:
Net Capital Spending = Initial Investment + Aftertax salvage value
Project Cash Flow Difference
Cash flow difference due to investment = Operating cash flow after investment - Operating cash flow before investment
Total project cash flow = Cash flow differences due to investmnet + Net Capital Spending
Net Present Value and Internal Rate of Return
Net Present Value is calculated using Excel's NPV function on the Total project cash flow. Internal Rate of Return is calculated using Excel's IRR function on the Total project cash flow.
Scenario Analysis
Estimating the cash flow of a project is typically very difficult and requires many carefully thought of assumptions. A wrong assumption on the number of units sold or the fixed costs might result in an entirely different decision made. It is thus prudent and useful to perform a Scenario Analysis during Capital Budgeting.Scenario Analysis basically involves estimating the cash flows on a Base Case, Worst Case and Best Case scenario. The ProjectCashFlowScenarioAnalysis worksheet allows Scenario Analysis to be performed easily. It allows the inputs of the Base Case scenario, Worst Case scenario and Best Case scenario to be entered into the same worksheet. After which, the cash flow is automatically projected based on the scenario selected and the Net Present Value and Internal Rate of Return is calculated for the selected scenario.
Assumptions
This worksheet performs capital budgeting analysis by making three basic assumptions. The assumptions are the Discount Rate to use in the investment project, the company's Tax Rate and the estimated percentage of Net Working Capital over Sales.
Forecasting Base Case, Worst Case and Best Case
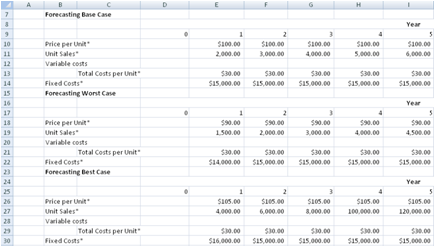
The next three sections of the worksheet allow the inputs of the different scenarios to be entered. The following inputs are required for each of the scenario.
- Price per Unit
- Unit Sales
- Total Costs per Unit
- Fixed Costs
The worksheet allows the scenario of the cash flow to be selected. Based on the selection, the project income and cash flow of the specified scenario will be generated and calculated.

The Forecasting Case Scenario field is defined using a control. The control is set to the following selections.
| Base Case |
| Worst Case |
| Best Case |
When a selection is made, the control will return a number to cell D32. Based on the number returned, the worksheet will generate the project income and cash flow of the selected scenario.
| Base Case | 1 |
| Worst Case | 2 |
| Best Case | 3 |
The following fields in the Projected Income section depend on the number return above to decide which inputs from which scenarios to use.
- Price per Unit
- Unit Sales
- Total Costs per Unit
- Fixed Costs
The net income of the project is calculated by using the following formula:
Net income = Earnings before Interest & Taxes (EBIT) - Taxes
where
EBIT = Net Sales - Total Variable Costs - Total Fixed Costs - Depreciation
The rest of the worksheet is exactly similar to the first worksheet ProjectCashFlow-NPV.
Back to Excel Templates and Add-In.