Free Gantt Chart
A Gantt Chart is a type of bar chart that is useful for showing the scheduled and actual progress of a project. Developed by Henry Gantt in the 1917, the Gantt Chart is now regarded as the standard project management charting technique. Its simplicity allows it to be easily understood by many people and with the use of a computer software, a Gantt Chart can be generated and modified very quickly and easily.This spreadsheet provides a flexible and extensible Gantt Chart schedule. It is very simple to use. The user simply keys in a few inputs like task name, start date, duration in days and percent completed, after which, a Gantt Chart will be generated automatically for tracking the project. The spreadsheet is arranged in a manner to be printed easily in Landscape mode or it can be saved to a PDF file using Excel to be emailed to the relevant parties. The diagram below shows a sample of the spreadsheet Gantt Chart.
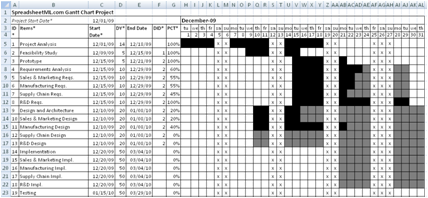
Download Free Gantt Chart - v1.0
System RequirementsMicrosoft® Windows 7, Windows 8 or Windows 10
512 MB RAM
5 MB of Hard Disk space
Excel 2007, 2010, 2013 or 2016
License
By downloading this software from our web site, you agree to the terms of our license agreement.
Download
FreeGanttChart.zip (Zip Format - 93 KB)
Get the Professional Project Management Package
Benefits- Unlocked
- Allows removal of copyright message in the template
- Allows commercial use within the company
- 12 months Gantt Chart schedule
- Critical Path Method (CPM) / Critial Path Analysis
- Allows customization
- Full source code
Price
USD29.90 - Purchase