Company Financial Plan
This spreadsheet provides a complete three (or five) year company financial plan. It assumes no prior accounting knowledge and guides you through the steps in forecasting sales, calculating expenses, borrowing funds and purchase of fixed assets. With the inputs, the spreadsheet automatically generates a complete three (or five) year financial plan and forecasts including monthly and yearly Income Statements, Balance Sheets and Cash Flow Statements. A Common Size Financial Statement, a Financial Ratio Analysis worksheet and a Valuation report are also generated automatically for further analysis of the company.
PDF Specifications - Purchase - License
Price USD$69
BonusFinancial Planning and Forecasting using historical Financial Statements
Priority Technical Support, Free upgrades for a year
ConnectCode provides excellent priority email support to our registered customers. Customers are also entitled to a one year free upgrade of the software.System Requirements
- Windows 7 or Windows 8 or Windows 10
- 512 MB RAM
- 5 MB of Hard Disk space
- Excel 2007, 2010, 2013 or 2016
Spreadsheet Overview
In general, inputs for the following are required.- Sales Plan
- Expenses
- Loan
- Fixed Assets Purchases
- Equity Capital
- Loan Amortization
- Fixed Assets Depreciation (Flexible choice in the number of years for depreciation)
- Expenses Summary
- Equity funds and dividends
- Monthly and Yearly Income Statements
- Monthly and Yearly Balance Sheets
- Monthly and Yearly Cash Flow Statements
- Common Size Financial Statements
- Financial Ratio Analysis
- Valuation (using Free Cash Flow to Equity)
Company Financial Plan Input Worksheets
The Financial Plan spreadsheet can be used by entering values from the first worksheet to the last worksheet in a sequential manner. All worksheets with names ending with "Inputs", for example, "SalesInputs" requires inputs to be entered. The values in other worksheets are automatically generated. Fields marked with "*" in the input worksheets require input values, other fields are used for interim calculations.General Inputs
This is the first worksheet and is used for entering general inputs and assumptions.- Company Name* - The name of the company.
- Date* - The start date for the financial plan.
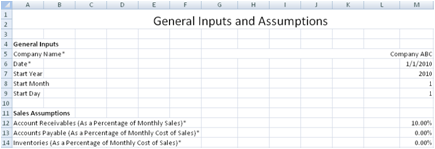
Sales Assumptions
Operating a business typically involves purchasing raw materials or services from suppliers, processing of the materials and selling the finished products to customers. In the process, customers may pay for the products delivered immediately or at a later time. Products that have been produced may be sold immediately or put in the warehouse waiting to be sold. Raw materials purchased from suppliers may be paid immediately or given a grace period to be paid at a later time. The following are three assumptions that we will need to make for calculating the capital required to run a business as described above.- Accounts Receivables (As a Percentage of Monthly Sales)* - Accounts Receivables is an item in the balance sheet. It is basically the money owed to the company by customers for products and services that have been delivered. This is expressed as a percentage out of monthly Sales. One way of getting this percentage is to derive it by conducting research on public companies in a similar business. With the assumed value entered, the rest of the worksheets including the balance sheet will use this field for calculation automatically.
- Accounts Payable (As a Percentage of Monthly Cost of Sales)* - Accounts Payable is an item in the balance sheet. It is the company's obligations to suppliers for products purchased that have not been paid. This is expressed as a percentage out of monthly Cost of Sales.
- Inventories (As a Percentage of Monthly Cost of Sales)* - Inventories is an item in the balance sheet. It represents any finished or unfinished products waiting to be sold. This is expressed as a percentage out of monthly Cost of Sales.
Tax Inputs
The Financial Plan spreadsheet allows monthly tax rates to be entered in this worksheet. With the inputs, the total tax will be automatically calculated in the Income Statement.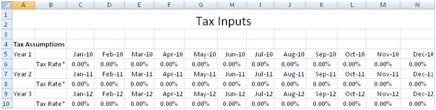
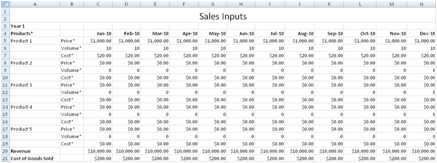
Sales Inputs
Businesses earn a profit by selling goods, products or services. This worksheet is used for forecasting the sales for the next three (or five) years. Simply enter the values for the following fields and the sales forecast will automatically be incorporated into the financial statements.- Price* - The price of the goods, products or services.
- Volume* - The number of units of the goods or products sold.
- Cost* - The direct cost of the goods or products. This is the usually cost for manufacturing the product.
Sales Outputs
The Sales Outputs worksheet contains a summary of the derived values from the Sales Inputs worksheet. Basically it contains the Revenue and Cost of Goods Sold in a monthly format. No inputs are required in this worksheet.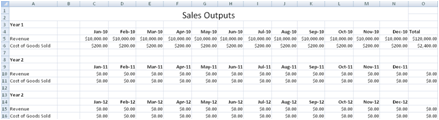
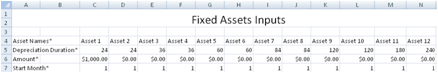
Fixed Assets Inputs
A fixed asset is a long term asset and is considered to provide benefits to the business of the company. Examples for fixed assets include machineries, equipments and plants. Depreciation quantifies for the wear and tear of this fixed asset by spreading out the reduction of the value of the fixed asset over a period of time. This worksheet allows you to enter the purchase of fixed assets at any time during the planning period. By specifying the following fields, depreciation of the assets are automatically incorporated into the Income Statement, Balance Sheet and Cash Flow Statement.- Asset Names* - Names of the Fixed Assets.
- Depreciation Duration* - This field allows you to specify the number of months for the depreciation of the fixed asset.
- Amount* - The cost of the fixed asset.
- Start Month* - The month to start depreciating the asset.
Fixed Assets Output
This is a summary output of the Fixed Assets purchases and the Monthly Depreciation associated.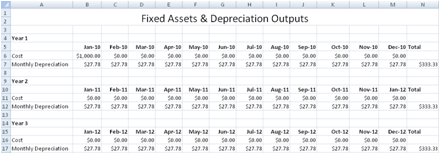
Expenses Inputs
Other than the direct costs associated with producing goods and services, other costs like salary, marketing and administrative expenses will need to be calculated to determine the profitability of the company. This worksheet allows all the selling, administrative and general costs of running a business to be entered. All the expenses in the "Expenses SubCategory*" will be summed as expenses in the "Expenses Category*". The expenses are then incorporated into the financial statements.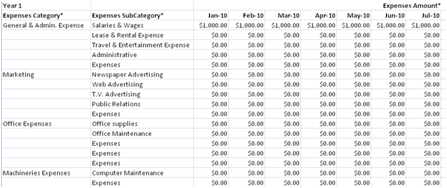
Expenses Outputs
This worksheet shows the summary of the total of the high level category expenses to be included into the financial statements.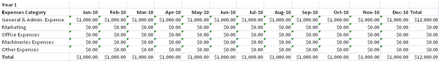
Loan Inputs
Capital is required for running a business. Capital can come from funds that are provided by the investors or loans from financial institutions. This worksheet considers the loan taken from financial institutions. By specifying the following fields, the loan will be automatically amortized and incorporated into the financial statements.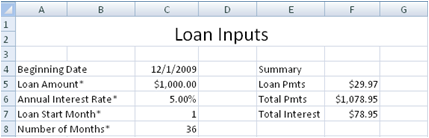
- Loan Amount* - The amount that the financial institution loans to the company.
- Annual Interest Rate* - The interest rate per year.
- Loan Start Month - The month where the loan is taken.
- Number of Months* - The total number of months for the loan to be paid off.
Loan Outputs
This is a summary output of the Loan Inputs showing the Monthly Interests to be paid and the outstanding Loan Balances.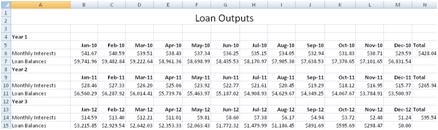
Equities Inputs
Capital for running the business can also come from funds provided by the investors. The funds can be provided when the company is formed or by investors that provide additional capital during the financial plan period. A finance charge may also be involved for raising capital from the investors. This worksheet considers the funds provided by investors for running the business.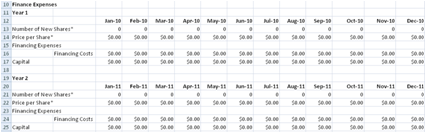
Funds provided by shareholders during Company Formation
- Number of Existing Shares* - Number of shares issued during the formation of the company.
- Par Value* - The stated or face value of the shares.
- Issue Price* - Shares may be issued above the par value. The difference between the Issue Price and Par Value will be calculated as Capital Surplus in the financial statements.
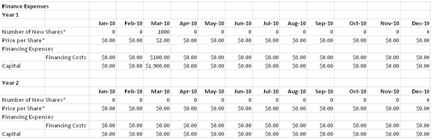
Funds provided by shareholders during the Financial Plan period
- Number of New Shares* - Number of new shares to be issued to raise funds.
- Price per Share* - The issue price of the share.
Dividends Payout
Dividends represents a portion of the company's net income that is returned to shareholders. They are typically payout in a quarterly basis. This worksheet allows you to enter Dividends Payout in any months during the financial plan period.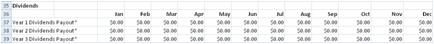
Company Financial Plan Output Worksheets
The Financial Plan spreadsheet automatically generates the Monthly Income Statement Plan, Balance Sheet Plan and Cash Flow Statement Plan for the next three (or five) years. The Yearly Income Statement, Balance Sheet and Cash Flow Statement are also provided in the Financial Statements Forecast worksheet.Finally a Common Size financial statement and Financial Ratio analysis worksheet are provided for further analyzing the company.
Income Statement Plan (By Months)
The Monthly Income Statement Plan shows the profitability of a company over the next three (or five) years breakdown by months.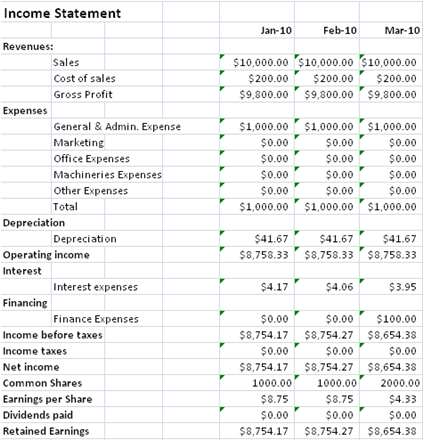
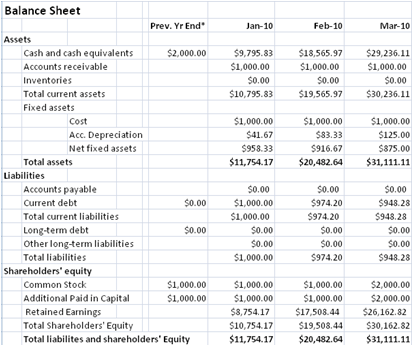
Balance Sheet Plan (By Months)
The Balance Sheet Plan shows the company's resources and how they are funded (debt or shares) in months.There is an optional input field, "Long-term debt" in these worksheets. It is included to make the Balance Sheet complete. If you are familiar with this field in the Balance Sheet, you can choose to input the values, otherwise you can leave it as zero.
Cash Flow Statement Plan (By Months)
The Monthly Cash Flow Statement Plan shows the monthly Cash inflows and outflows of the business over the next three (or five) years.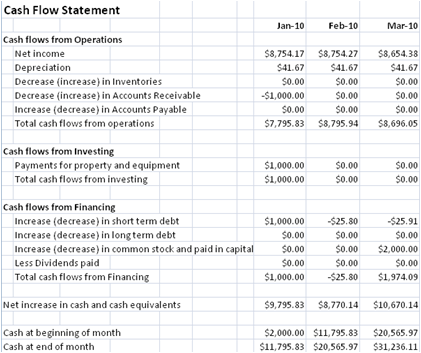
Financial Statements Forecast (Annual)
This worksheet contains the annual financial statements for the next three (or five) years summarised from the Monthly Statements.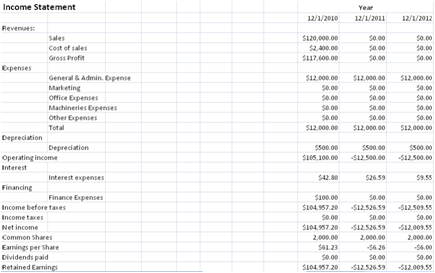
Common Size Financial Statements
The Common Size Financial Statements express all the fields in the Income Statement and Balance Sheet as a ratio over Sales. By expressing the fields in ratio, a standardized financial statement can be created to reveal insights and trends of companies. It will be easy to compare financial statements of different size companies or the same company at different times.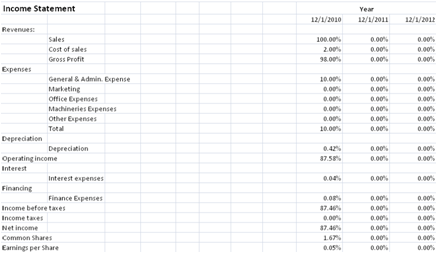
Financial Ratio Analysis
This worksheet contains all commonly-used industry financial ratios for further analyzing of the company.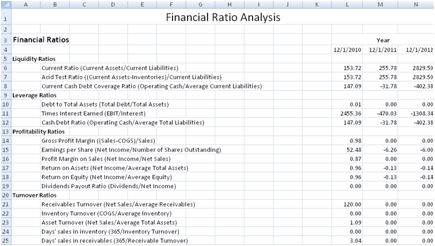
Liquidity Ratios
The liquidity ratios provide information on a company's ability to repay its short-term debt.- Current Ratio = (Current Assets/Current Liabilities)
- Acid Test Ratio = ((Current Assets-Inventories)/Current Liabilities)
- Current Cash Debt Coverage Ratio = (Operating Cash/Average Current Liabilities)
Leverage Ratios
The leverage ratios provide information on a company's long-term solvency. The leverage ratios focus on the long term unlike liquidity ratios which focus on the short term.- Debt to Total Assets = (Total Debt/Total Assets)
- Times Interest Earned = (EBIT/Interest)
- Cash Debt Ratio = (Operating Cash/Average Total Liabilities)
Profitability Ratios
The profitability ratios provide information on the success of the company at making profits.- Gross Profit Margin = ((Sales-COGS)/Sales)
- Earnings per Share = (Net Income/Number of Shares Outstanding)
- Profit Margin on Sales = (Net Income/Net Sales)
- Return on Assets = (Net Income/Average Total Assets)
- Return on Equity = (Net Income/Average Equity)
- Dividends Payout Ratio = (Dividends/Net Income)
Turnover Ratios
Receivables turnover provides information on how quickly a company collect its accounts receivables. Inventory turnover provides information on the number-of-days worth of inventory on-hand. A low turnover may point to a situation where overstocking has occurred. Asset turnover ratios provide information on how efficiently a company utilizes its assets.- Receivables Turnover = (Net Sales/Average Receivables)
- Inventory Turnover = (COGS/Average Inventory)
- Asset Turnover = (Net Sales/Average Total Assets)
- Days' sales in inventory = (365/Inventory Turnover)
- Days' sales in receivables = (365/Receivable Turnover)
Equity Valuation
Valuation using Free Cash Flow to Equity
This worksheet values the company's share price by using the Free Cash Flow to Equity model. The Free Cash Flow to Equity is defined as the sum of the cash flows to the equity holders in the firm.Valuation Summary
The Free Cash Flow to Equity (FCFE) is calculated as follows:FCFE = EBIT * (1-Tax rate) + Depreciation - Capital expenditure - Change in Working Capital + New debt issued - Debt repayments
The terminal value of the firm's equity beyond the projection horizon is also estimated and added to the cash flow. The final cash flow discounted with the cost of equity provides the equity value.
Assumptions
The following are inputs to be entered into the spreadsheet as assumptions. The values will be used for valuation.- Cost of Equity - This is used to discount the cash flow to equity.
- Growth rate of Cash Flow after projection horizon - A fix growth rate after the projection horizon. This growth rate is used in the estimation of the Terminal Value of the company.
- Value of Non Operating Assets - The Discounted value of the Free Cash Flow to Equity yields the value of the operating assets. The equity value can be derived by adding the value of the Non Operating Assets from the value of the operating assets.
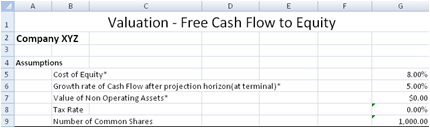
The following values are calculated from the previous worksheets.
- Tax Rate - Company's Tax Rate. This is calculated as the average of the monthly tax rate in the tax inputs worksheet.
- Number of Common Shares - The equity value will be divided by the number of common shares to determine the price per share. This value is derived from the Number of Common Shares in the Income Statement.
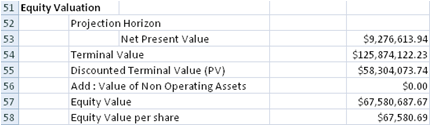
Equity Valuation
Terminal Value
The Terminal Value of the Firm's Equity is estimated as follows:Terminal Value = Final Year Cash Flow * (1+Growth rate of Cash Flow after projection horizon) / (WACC Discount Rate - Growth rate of Cash Flow after projection horizon)
Operating Value
Operating Value is calculated as follows:Value of Operating Assets = Net Present Value of Cash Flows + Discounted Terminal Value
Equity Value
Equity Value is calculated as follows:Equity Value = Value of Operating Assets + Value of Non Operating Assets
Printing
These spreadsheets can be printed quickly and easily in Landscape mode in Microsoft Excel. Simply set the "% to normal size" option to include all the fields in the worksheets.To print several worksheets at once, simply click the tab for the first sheet in Excel, then hold down CTRL while you click the tabs of the other sheets that you want to select.
Back to Excel Templates and Add-In