Finance Spreadsheets - Windows Store App
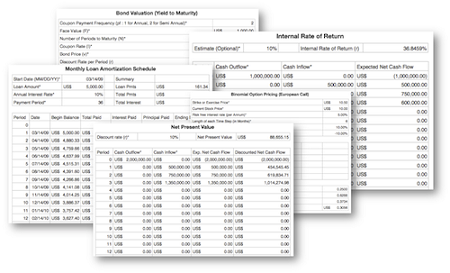
Finance Spreadsheets is a comprehensive suite of investment spreadsheets and modeling templates developed by ConnectCode. Equipped with over 50 financial templates in many different categories of finance, it significantly improves the productivity of investors and analysts on financial calculation, modeling and analysis.The Finance Spreadsheets app serves as an index for ease of access to all spreadsheets. Upon selecting a particular finance subject, the app will display the general usage description of the spreadsheet and provide the option to launch the spreadsheet in Microsoft Excel.

Types Of Finance Calculations
In general, the spreadsheets evaluates portfolio performance by using Sharpe's Ratio, Treynor Index and Portfolio Risk techniques; creates complete loan amortization schedules for different payment frequencies; manages investments by valuing bonds, options and equities; calculates various types of yields and returns; determines the Cost of Equity using Dividend Growth Model and Capital Asset Pricing Model (CAPM); evaluates the share price of a company using Free Cash Flow to Equity and Free Cash Flow to Firm; determines the feasibility of an investment through Capital Budgeting; calculates Time Value of Money (TVM) such as Present Value (PV), Future Value (FV), Net Present Value (NPV) and Internal Rate of Return (IRR).
A Little More On Our Spreadsheets
Have you thought about how many times you use or reuse your financial models? Everyday, day after day, model after model and project after project. We definitely have. That is why we build all our financial templates in a reusable, customizable and easy to understand manner. We also conduct vigorous tests on our templates with different scenarios, so that you know you can be assured of their accuracy and quality and that you can save significant amount of time by reusing them. We also provide comprehensive documentation on the templates so that you understand how our models work.Our template models are available only in black and white color. We believe this is how a professional financial template should look like and this is the easiest way for you to understand and use the templates. All the input fields are marked with the ‘*’ symbol for you to identify them easily.
Whether you are a financial analyst or investment banker, whether you are a student aspiring to join the finance world or an entrepreneur needing to understand finance, we hope you will find this touch-based spreadsheet package useful as we have put in our best effort and invested a lot of time to develop them.
Benefits Of Using Our Spreadsheets
- Industry Proven - We have distributed financial spreadsheets for many years. All the models and templates are tested vigorously and have received positive feedbacks from the industry.
- Ease of Use - The spreadsheets are designed for touch devices and are ready for use out-of-the-box. The comprehensive in-app documentation also enables quick understanding and and use of the spreadsheets.
- Ease of Customization - Our models are designed to ease customization and can be easily reuse in other financial models.
Requirements
WinRT / Windows 8 / Windows 8 Pro / Windows 10 S / Windows 10 ProDownload

List Of Spreadsheet Models
Bond Valuation
- Bond Valuation (Bond Price)
- Bond Valuation (Yield to Maturity)
- Bond Duration and Convexity
Capital Budgeting
- Capital Budgeting
- Lease vs Buy (Net Advantage to Leasing)
Cost of Capital
- Weighted Average Cost of Capital (WACC)
Cost of Equity (based on)
- Capital Asset Pricing Model
- Capital Asset Pricing Model based on Market Risk Premium
- Cost of Equity (Gordon Dividend Growth Model)
- Cost of Equity (Gordon Dividend Growth using Dividend History)
Effective Annual Rate
- Effective Annual Rate
Equity Valuation (using Dividends)
- Price of Stock (Constant Growth Dividend)
- Price of Stock (Non Constant Growth Dividend)
- Price of Stock (Two Stage Growth Dividend)
- Price of Stock (Zero Growth Dividend)
Equity Valuation (using Free Cash Flow)
- Free Cash Flow To Equity
- Free Cash Flow To Firm
Future Value
- Future Value of a Lump Sum
- Future Value of a Lump Sum with Continuous Compounding
- Future Value of a Lump Sum with more than 1 Compounding Period per Year
- Future Value of a Series of Unequal Cash Flow
- Future Value of an Annuity
Holding Period Return
- Holding Period Return
Inflation
- Inflation Calculator (US)
Loan Amortization
- Annual Loan Amortization Schedule
- Half Yearly Loan Amortization Schedule
- Quarterly Loan Amortization Schedule
- Bi-Monthly Loan Amortization Schedule
- Monthly Loan Amortization Schedule
- Weekly Loan Amortization Schedule
Net Present Value
- Net Present Value
- Net Present Value for Multiple Projects
- Net Advantage to Leasing
Options Valuation
- Binomial Option Pricing (American Call)
- Binomial Option Pricing (American Put)
- Binomial Option Pricing (European Call)
- Binomial Option Pricing (European Put)
- Option Pricing (Black Scholes)
Portfolio Performance
- Jensen Alpha
- Portfolio Risk
- Sharpe Ratio
- Sharpe Ratio (Multiple Portfolio)
- Treynor Performance Index
- Treynor Performance Index (Multiple Portfolio)
Present Value
- Present Value of a Lump Sum
- Present Value of a Lump Sum with more than 1 Compounding Period per Year
- Present Value of a Perpetuity
- Present Value of a Series of Unequal Cash Flow
- Present Value of an Annuity
Rate of Return
- Internal Rate of Return
- Time Weighted Rate of Return
Terminal Value
- Terminal Value
- Terminal Value (Two Stage Growth)
Yield
- Bank Discount Yield
- Effective Annual Yield
- Holding Period Yield
- Money Market Yield (CD Equivalent Yield)
