- TinyGraphs
- SparkCode Professional
- Duplicate Remover
- ConnectCode Deluxe Add-In
- ConnectCode Barcode Font Pack
- Barcode Software - by BarcodeResource.com
- ConnectCode Number Manager
- ConnectCode Text Manager
- TraderCode Technical Indicators
- Neural Networks Trading
- Financial Modeling - Free Investment and Financial Calculator
TinyGraphs Excel Add In
TinyGraphs is an open source add-in for Excel that creates sparklines, mini column graphs, and area graphs from a row of data. It generates beautiful tiny graphics that are as small as a cell and is useful for visualizing large quantities of data, such as stock prices and exchange rates.
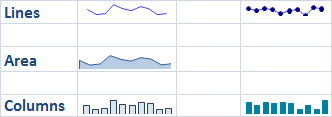
What does TinyGraphs do ?
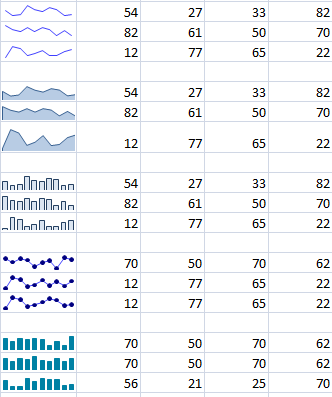
TinyGraphs creates a tiny chart for every row of data in a rectangular block of cells (user specified range).
A sample Excel file that contains TinyGraphs can be found here TinyGraphsSample.xls
Screenshots for TinyGraphs
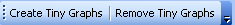
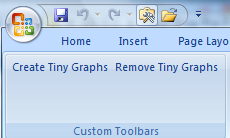
The TinyGraphs toolbar in Excel 2003 and Excel 2007
The main dialog for TinyGraphs
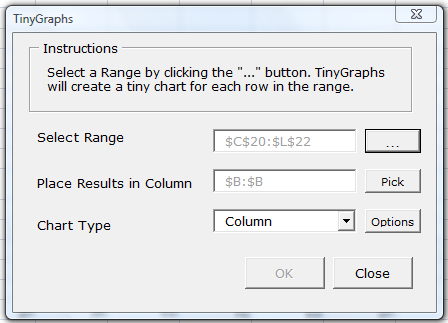
Using the TinyGraphs plugin is very simple. Click the Create Tiny Graphs button to bring up the main dialog, then select a range of data, a column to place the sparklines and graphs, and a chart type. Click the OK button in the main dialog to generate the graphs.
Download Add-In
Download the TinyGraphs Add-in for Excel now. (Freeware)
TinyGraphs.exe (350 KB)
Requirements :
Excel 2007, 2010, 2013 or 2016
After a successful installation, the TinyGraphs toolbar will be available in Excel 2003. For Excel 2007, the toolbar is found in the Add-Ins Tab.
Source Code
TinyGraphs is written as Excel VBA Macros and the source code can be viewed in the Excel Visual Basic Editor.
Download TinyGraphs.xls to customize the source code now.
Please note that the source for TinyGraphs is released under the Microsoft Community License (Ms-CL)
Credits
Thanks to Gerard from Netherlands for fixing the bug that makes Tinygraphs work in Excel 2003.