Parabolic Time/Price System (SAR)
Parabolic Time/Price System is also known as the Stop and Reverse System. It is a useful technical indicator in a trending market for identifying when to enter into a long or short position and when to stop and reverse your position.Patterns
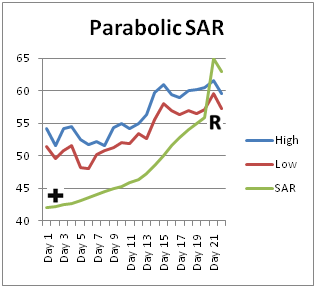
+ for Long (Buy) and R for Long to Short Reversal
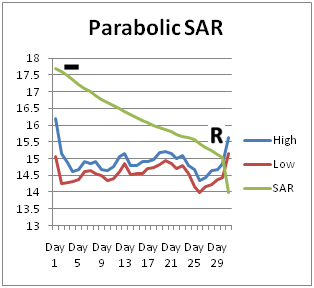
- for Short (Sell) and R for Short to Long Reversal
How to use it?
Go long (buy) when the SAR is below the price and go short (sell) when the SAR is above the price. When the price penetrates the SAR, it is a Stop and Reverse point. If the price penetrates the SAR from above, stop going long and reverse to short. If the price penetrates the SAR from below, stop going short and reverse to long.Background
This technical indicator is introduced by J. Welles Wilder, Jr. in his book "New Concepts in Technical Trading Systems" released in 1978. The name of the indicator is due to the nature that it resembles a parabola curve. It is a very popular technical indicator for setting trailing price stops for long or short positions.Brief explanation for better understanding of this technical indicator
The general formula for calculating SAR is as follows:SAR for the Next Day = SAR Today + Acceleration Factor * (Extreme Point - SAR Today)
Acceleration Factor starts from 0.02 and is incremented by 0.02 each time a new Extreme Point is reached and is capped at a maximum of 0.2. When the position reverses, the Acceleration Factor is reset to 0.02. The Extreme Point is the extreme price point since the position started. If you have started long 10 days ago, it is the highest price of the stock since then. If short, it is the lowest price of the stock since then.
To illustrate an example for the formula, let's assume you are going long and the price is on an uptrend. The SAR today is 30. From the point you have started long, the highest price reached is 35.
SAR for the Next Day = 30 + 0.02 * (35 - 30) = 30.3
On the following day, the price increases to 36.
SAR for the Next Day = 30.3 + 0.04 * (36 - 30.3) = 30.528
For going short, the example above is calculated in a similar manner except that the Extreme Point is the extreme low.
Back to TraderCode Technical Analysis Software