Free Corporate Financial Planning and Forecasting Spreadsheet - Pro Forma Financial Statements
Pro Forma Financial Statements
Financial statements projections and forecasting are very common in corporate financial analysis. The reason is that it is very useful and important to forecast how much financing a company will require in future years. The projections are achieved by using historical sales, accounting data and assumptions on future sales and costs. These financial statements projections are known in financial modeling as Pro Forma financial statements.Financial Statements Modeling
This spreadsheet provides a template for financial statements forecasting. It requires simple financial statements inputs from the past 5 years and will automatically generate all the necessary Pro Forma Financial Statements projections outputs.The following diagram illustrates the process of using this template for financial statements forecasting. Most inputs are required in the first step. The rest of the four steps involve reviewing the outputs generated and entering values like short term interest rates to be assumed in the model.

Financial Planning and Forecasting Spreadsheet
Financial Statements Inputs
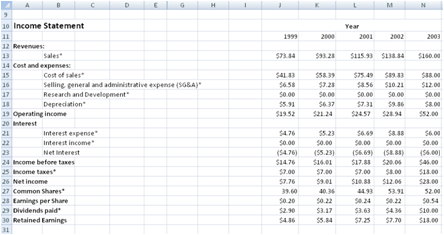
The template requires inputs from the Income Statement and Balance Sheet from the past 5 years.Income Statement
All inputs are marked with the "*" symbol.

The fields that are automatically calculated as shown in bold below.
Revenues
	Sales*
Cost and expenses:
	Cost of sales*
	Selling, general and administrative expense (SG&A)*
	Research and Development*
	Depreciation*
Operating income = Sales - Cost and expenses

Interest
	Interest expense*
	Interest income*
        Net Interest = Interest income - Interest expense
Income before taxes = Operating income + Net Interest
Income taxes*
Net income = Income before taxes - Income taxes
Common Shares*
Earnings per Share = Net income / Common Shares
Dividends paid*
Retained Earnings = Net income - Dividends paid
|
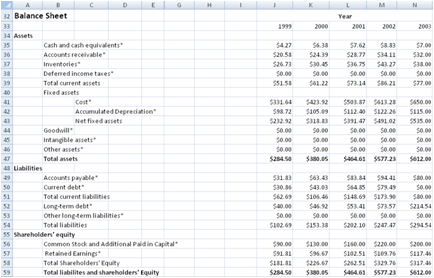
Balance Sheet
All inputs are marked with the "*" symbol.
The fields that are automatically calculated as shown in bold below.
Assets
	Cash and cash equivalents*
	Accounts receivable*
	Inventories*
	Deferred income taxes*
        Total current assets = Cash and cash equivalents
	+ Accounts receivable
	+ Inventories + Defered income taxes
	Fixed assets
		Cost*
		Accumulated Depreciation*
                Net fixed assets = Fixed Assets Cost
		- Accumulated Depreciation
	Goodwill*
	Intangible assets*
	Other assets*
        Total assets = Total current assets
	+ Net fixed assets
	+ Goodwill
	+ Intangible assets + Other assets
Liabilities
	Accounts payable*
        Current debt = Total liabilities
	- Accounts payable
	- Long-term debt
	- Other long-term liabilities
        Total current liabilities = Accounts payable
	+ Current debt
	Long-term debt*
	Other long-term liabilities*
        Total liabilities = Total liabilities
	and shareholder's Equity
	- Total Shareholders' Equity
Shareholders' equity
	Common Stock and Additional Paid in Capital*
	Retained Earnings*
        Total Shareholders' Equity = Common Stock and
	Additional Paid in Capital
	+ Retained Earnings
        Total liabilities and shareholders'Equity=Total assets
|
The Total liabilities and shareholders' Equity field is worth noting. It is set to be equal to the Total assets in the spreadsheet.
Total liabilities and shareholders' Equity = Total assets
Total liabilities field is calculated as follows:
Total liabilities = Total liabilities and shareholder's Equity - Total Shareholders' Equity
The Current debt field is the Plug. It is defined as follows:
Current debt = Total liabilities - Accounts payable - Long-term debt - Other long-term liabilities
Common Size Financial Statements
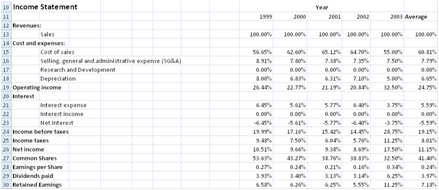
The Common Size Financial Statements express all the fields in the Income Statement and Balance Sheet as a ratio over Sales. By expressing the fields in ratio, a standardized financial statement can be created to reveal insights and trends of companies. It will be easy to compare financial statements of different size companies or the same company at different times. For example, a company may have grown to be very large over the years.
Fields from the Income Statement
- Cost of Sales in 1999 = Cost of Sales in 1999 / Sales in 1999
- Cost of Sales in 2000 = Cost of Sales in 2000 / Sales in 2000
- Depreciation in 1999 = Depreciation in 1999 / Sales in 1999
- Interest expense in 2003 = Interest expense in 2003 / Sales in 2003
- Cash and cash equivalents in 2001 = Cash and cash equivalents in 2001 / Sales in 2001
- Accounts receivable in 2002 = Accounts receivable in 2002 / Sales in 2002
An average of the past 5 years percentage is also calculated. This average will be useful for projections and forecasting of future financial positions.
Analysis Findings

- Sales Growth Rate = (Sales in Current Year - Sales in Previous Year) / Sales in Previous Year
- Tax Rate = Income taxes / Income before taxes
- Dividends payout ratio = Dividends paid / Net income
Financial Statements Forecast
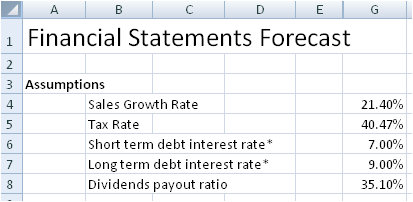
The main inputs in the Financial Statements Forecast worksheet are the Short term and Long term debt interest rate. By default, The Sales Growth Rate, Tax Rate and Dividends payout ratio make use of the average value for the past 5 years. Adjustments can be further made to these figures for better accuracy in forecasting.Assumptions

- Sales Growth Rate = Average Sales Growth Rate in Analysis Findings Worksheet
- Tax Rate = Average Tax Rate in Analysis Findings Worksheet
- Short term debt interest rate*
- Long term debt interest rate*
- Dividends payout ratio = Average Dividends payout ratio in Analysis Findings Worksheet
Financial Ratio Analysis
This worksheet outputs the different financial ratios calculated from the Income Statement and Balance Sheet from the other worksheets.
Inputs
The Share Price for the different years is the only input in this worksheet. Using the Share Price and information from other worksheet like assets, liabilities, cash and costs, the different ratios are calculated.
Liquidity Ratios
The liquidity ratios provide information about a company's ability to repay its short-term debt.
- Current Ratio = (Current Assets/Current Liabilities)
- Acid Test Ratio = ((Current Assets-Inventories)/Current Liabilities)
- Current Cash Debt Coverage Ratio = (Operating Cash/Average Current Liabilities)
The leverage ratios provide information about a company's long term solvency. The leverage ratios focus on the long term as compared to liquidity ratios which focus on the short term.
- Debt to Total Assets = (Total Debt/Total Assets)
- Times Interest Earned = (EBIT/Interest)
- Cash Debt Ratio = (Operating Cash/Average Total Liabilities)
The profitability ratios provide information about the success of the company at making profits.
- Gross Profit Margin = ((Sales-COGS)/Sales)
- Earnings per Share = (Net Income/Number of Shares Outstanding)
- Profit Margin on Sales = (Net Income/Net Sales)
- Return on Assets = (Net Income/Average Total Assets)
- Return on Equity = (Net Income/Average Equity)
- Price Earnings Ratio = (Share Price/EPS)
- Dividends Payout Ratio = (Dividends/Net Income)
Receivables turnover provides information on how quickly a company collect its accounts receivables. Inventory turnover provides information about the number-of-days worth of inventory on hand. A low turnover may point to a situation where overstocking has occurred. Asset turnover ratios provide information on how efficiently a company utilizes its assets.
- Receivables Turnover = (Net Sales/Average Receivables)
- Inventory Turnover = (COGS/Average Inventory)
- Asset Turnover = (Net Sales/Average Total Assets)
- Days' sales in inventory = (365/Inventory Turnover)
- Days' sales in receivables = (365/Receivable Turnover)
Download Free Corporate Financial Planning and Forecasting spreadsheet - v1.0
System RequirementsMicrosoft® Windows 7, Windows 8 or Windows 10
Windows Server 2003, 2008, 2012 or 2016
Mac® OS X
512 MB RAM
5 MB of Hard Disk space
Excel Excel 2007/2010/2013/2016 or Office for Mac OS
License
By downloading this software from our web site, you agree to the terms of our license agreement.
Download
FreeFinancialPlanningAndForecasting.zip (Zip Format - 232 KB)
Get the Professional version
Benefits- Unlocked
- Allows removal of copyright message in the template
- Allows commercial use within the company
- Allows full customization of the model
Price
USD49.00 - Purchase
or Get the Complete Company Financial Plan package
