Professional Stock Beta Calculator Spreadsheet
PriceUSD30.00 - Purchase
License
Commercial License
Bonus System Requirements
Microsoft® Windows 7, Windows 8 or Windows 10
Windows Server 2003, 2008, 2012 or 2016
512 MB RAM
5 MB of Hard Disk space
Excel 2007, 2010, 2013 or 2016
Download for Free now! - Find out more on this spreadsheet below.
Stock Beta
Stock Beta is the measure of the risk of an individual stock. Basically, it measures the volatility of a stock against a broader or more general market. It is a commonly used indicator by financial and investment analysts. The Capital Asset Pricing Model (CAPM) also uses the Beta by defining the relationship of the expected rate of return as a function of the risk free interest rate, the investment's Beta, and the expected market risk premium.Capital Asset Pricing Model (CAPM)
Expected rate of return = Risk free rate + Beta * (Market Risk Premium)
To interpret and understand the numbers from the Beta is simple and straight forward. The Beta of the general and broader market portfolio is always assumed to be 1. A stock Beta is calculated to be relative to the Beta of the broader market. Thus when a stock has a Beta that is greater than 1, it is considered to be more risky and more volatile than the broader market while a stock with a Beta of less than 1 is considered to be less risky and less volatile than the broader market. Finally a stock with a Beta equal to 1 is considered neutral and as volatile as the broader market.
The following formula is used for calculating the value of Beta.
Beta = Covariance(Rate of Return of Stock, Rate of Return of Market) / Variance of Market
Covariance is a measure of how two variables change together or is related and Variance is a statistical measure of the dispersion of values from the mean. The rest of this document will illustrate on how to calculate the Beta of an individual stock against the broader S&P 500 portfolio. The interesting part is we will be downloading live data from https://finance.yahoo.com to perform the calculation.
Stock Beta Calculator Spreadsheet
This Stock Beta Calculator spreadsheet allows you to calculate Beta of U.S stocks very easily. First, it provides the formulas for calculating the Beta. Second, and more importantly, it calculates the Beta by automatically downloading stock quotes and the S&P 500 data from https://finance.yahoo.com. The spreadsheet is shown below: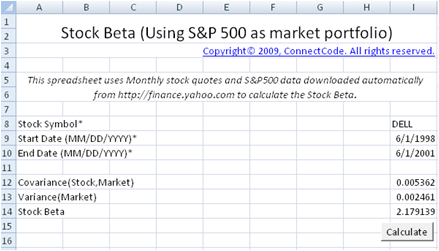
Inputs
- Stock Symbol - The Stock Symbol used by Yahoo Finance. For example, "YHOO" is the stock symbol for Yahoo. "MSFT" is the stock symbol for Microsoft. Check out https://finance.yahoo.com for the list of Stock Symbols supported.
- Start Date - The start date in MM/DD/YYYY format.
- End Date - The end date in MM/DD/YYYY format.
Outputs
After clicking on the Calculate button, an Excel VBA macro will be launched to download the Monthly Stock Quotes from the Start Date to the End Date of the specified Stock Symbol. The Monthly Returns in column H and column P are then tabulated in the StockBetaInternal spreadsheet. Before any calculation, please make sure you are connected to the internet.
The Stock Beta is calculated as the formula below.
Stock Beta = Beta = Covariance(Rate of Return of Stock, Rate of Return of Market) / Variance of Market
Advance Stock Beta Calculator
This spreadsheet builds on the Stock Beta Calculator described above. It adds the following capabilities.- The calculation of Daily, Weekly and Monthly returns. If you recall, the Stock Beta Calculator only supports Monthly returns.
- The calculation of the Beta for up to 5 stocks. If you recall, the Stock Beta Calculator only supports the calculation of Beta for one stock at one time.

Customizing the Stock Beta Calculator
This section describes the VBA source code used to construct the Stock Beta calculator. With the understanding of the basic source code it will be easy to customize the Stock Beta calculator or reuse and expand it in other financial models. The Advance Stock Beta Calculator will not be described. However by looking at the source code, you will find that it is similar to the basic Stock Beta Calculator.StockBetaInternal Worksheet
This worksheet is used internally by the calculator. Column A to column G contains the downloaded S&P 500 market data. The columns contain data that include Date, Open, High, Low, Close, Volume and Adj Close.
The Returns column is calculated by the VBA macro which we will describe below. It uses the latest Adj Close and the previous Adj Close to calculate the periodic rate of return. The formula used is shown below:
Returns = (Latest Adj Close - Previous Adj Close) / Previous Adj Close
The Returns column is tabulated for use in the calculation of the Covariance and Variance output.
Column I to column O contain similar information to the S&P 500 data except that the data is for the individual stock specified in the 'Stock Beta' worksheet. Column P is also calculated using the Returns formula above.
How is the data downloaded?
The Excel spreadsheet uses the macro DownloadData to automatically populate the data in the 'StockBetaInternal' worksheet. If you goto Developer->Visual Basic and open up the Microsoft Visual Basic Editor. After that, double click on the 'VBA Project (FreeStockBetaCalculator.xls)' and open up Module->Module1. This module contains all the source code for automatically downloading the data.GetStock subroutine
The VBA code for the GetStock subroutine is listed below. This function downloads data from https://finance.yahoo.com by specifying a Stock Symbol, Start Date and End Date. The last "desti" parameter specifies the location to place the downloaded data.
Sub GetStock(ByVal stockSymbol As String, ByVal StartDate As Date,
               ByVal EndDate As Date, ByVal desti As String)

    On Error GoTo ErrHandler:

    Dim crumb               As String
    Dim cookie               As String
    Dim response               As String
    Dim strUrl As String
    Dim DownloadURL As String
    Dim period1, period2 As String
    Dim httpReq As WinHttp.WinHttpRequest
    Set httpReq = New WinHttp.WinHttpRequest

    DownloadURL = "https://finance.yahoo.com/lookup?s=" & stockSymbol
    With httpReq
        .Open "GET", DownloadURL, False
        .setRequestHeader "Content-Type",
                      "application/x-www-form-urlencoded; charset=UTF-8"
        .send
        .waitForResponse
        response = .responseText
        cookie = Split(.getResponseHeader("Set-Cookie"), ";")(0)
    End With

    period1 = (StartDate - DateValue("January 1, 1970")) * 86400
    period2 = (EndDate - DateValue("January 1, 1970")) * 86400

    Dim counter As Long
    Dim startCounter As Long
    Dim result As String
    Dim dataResult As String
    Dim startResult As String

    crumb = Chr(34) & "CrumbStore" & Chr(34) & ":{" & Chr(34) & "crumb"
            & Chr(34) & ":" & Chr(34)
    startCounter = InStr(response, crumb) + Len(crumb)
    While Mid(response, startCounter, 1) <> Chr(34)
        result = result & Mid(response, startCounter, 1)
        startCounter = startCounter + 1
    Wend

    crumb = result
    Dim freq As String
    freq = "1mo"
    DownloadURL = "https://query1.finance.yahoo.com/v7/finance/download/"
                  & stockSymbol & "?period1=" & period1 & "&period2="
                  & period2 & "&interval="
		  & freq & "&events=history&crumb="
                  & crumb

    startResult = ""
    startCounter = 0
    While (startResult <> "Date" And startCounter < 8)
        With httpReq
            .Open "GET", DownloadURL, False
            .setRequestHeader "Cookie", cookie
            .send
            .waitForResponse
            dataResult = .responseText
        End With
        startResult = Mid(dataResult, 1, 4)
        startCounter = startCounter + 1
    Wend

    If (startResult <> "Date") Then
        noErrorFound = 0
        GoTo ErrHandler
    End If

    dataResult = Replace(dataResult, ",", vbTab)

    Dim dataObj As New DataObject
    dataObj.SetText dataResult
    dataObj.PutInClipboard

    Set currentWorksheet = ThisWorkbook.ActiveSheet
    Set currentRange = currentWorksheet.Range(desti)
    dataObj.GetFromClipboard
    currentRange.PasteSpecial

    noErrorFound = 1

ErrHandler:
    If noErrorFound = 0 Then
        Application.ScreenUpdating = True
        MsgBox ("Stock " + stockSymbol + " cannot be found.")
    End If
    'Resume Next
End Sub
In the whole block of code above, the most important part is the following.
    DownloadURL = "https://query1.finance.yahoo.com/v7/finance/download/"
                  & stockSymbol & "?period1=" & period1 & "&period2="
                  & period2 & "&interval=1d&events=history&crumb="
                  & crumb
    With httpReq
        .Open "GET", DownloadURL, False
        .setRequestHeader "Cookie", cookie
        .send
        .waitForResponse
        dataResult = .responseText
    End With
It basically says that we will be downloading data from DownloadURL:
https://query1.finance.yahoo.com/v7/finance/download/" & stockSymbol & "?period1=" & period1 & "&period2=" & period2 & "&interval=1d&events=history&crumb=" & crumb
- stockSymbol is the variable containing a stock symbol such as “BAC”.
- period1 and period2 specifies the start date and end date to download data.
- The “cookie” and “crumb” (extracted from response) required is extracted with the following VBA codes.
    DownloadURL="https://finance.yahoo.com/lookup?s="&stockSymbol
    With httpReq
        .Open "GET", DownloadURL, False
        .setRequestHeader "Content-Type",
		"application/x-www-form-urlencoded; charset=UTF-8"
        .send
        .waitForResponse
        response = .responseText
        cookie = Split(.getResponseHeader("Set-Cookie"), ";")(0)
    End With
DownloadData subroutine
This is the subroutine that is called by the Calculate button in the 'Stock Beta' worksheet.Calling the GetStock subroutine
The source code for the DownloadData subroutine is shown below. The sections highlighted in Red show the part where DownloadData calls the GetStock subroutine. The first subroutine call gets the S&P 500 data by passing the "^GSPC" symbol. The second call to the GetStock subroutine uses the stock symbol specified in the 'Stock Beta' worksheet to get the individual stock data.
