Professional Equity Valuation Spreadsheet Calculator
Price
USD30.00 - Purchase
License
Commercial License
System Requirements
Microsoft® Windows 7, Windows 8 or Windows 10
Windows Server 2003, 2008, 2012 or 2016
512 MB RAM
5 MB of Hard Disk space
Excel 2007, 2010, 2013 or 2016
Professional Stock/Equity Valuation Spreadsheet Calculator
Equity Valuation using the Dividend Discount Model
The Dividend Discount Model (DDM) is a method used for valuing the price of a stock for a company which pays out dividends. The model assumes that the price of a stock is equivalent to the sum of all of its future dividend payments discounted to the present value. The model is simple in theory but have various scenarios due to the different ways that dividends could be paid out. This spreadsheet allows you to value a stock using the Dividend Discount Model in the following scenarios:- Price of Stock with Zero Growth Dividends
- Price of Stock with Constant Growth Dividends (Gordon Model)
- Price of Stock at Time N (Terminal Value)
- Price of Stock with Two Stage Growth Dividends
- Price of Stock with Non Constant Growth Dividends
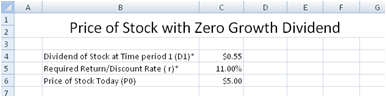
Price of Stock with Zero Growth Dividend
Consider the case where a company pays out all its earnings as dividends. In this case, no earnings are retained to further grow the company. The stockholders can expect that future earnings will be flat and there will not be any further increase in the dividends payout. If the above assumptions are made for a company, it will be very easy to value the price of the stock for this company. Using the Dividend Discount Model, we simply need to sum all the company's future dividends which is fixed at a constant amount. This is equivalent to the calculation of a perpetuity using the Time Value of Money concepts.The PriceofStock-ZeroGrowth worksheet calculates the Price of Stock using the perpetuity formula as below:
Price of Stock Today = Dividend of Stock at Time period 1 / Required Return/Discount Rate
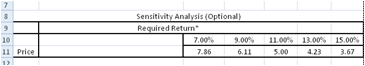
The PriceofStock-ZeroGrowth-SA worksheet also values the price of stock using the Dividend Discount Model and uses Excel Data Tables to perform Sensitivity Analysis on the price of stock by varying the Required Return.
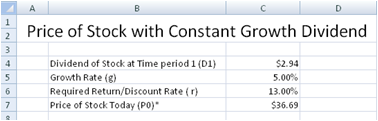
Price of Stock with Constant Growth Dividends (Gordon Model)
Consider the case where a company pays out part of its earnings as dividends and retains part of the earnings for future growth. If the company stays healthy, grows at a constant rate and is able to pay out dividends that grow at a constant rate, how do we value the price of the stock of this company?Using the Dividend Discount Model to value the price of the stock, we sum all the company's future dividends, which in this case is assuming to grow at a constant rate. This model is also known as Gordon Growth Model, named after it's author Myron Gordon.
The PriceofStock-ConstantGrowth worksheet calculates and values the price of the stock using the following formula:
Price of Stock Today = Dividend of Stock at Time period 1 / (Required Return-Growth Rate)
The PriceofStock-ConstantGrowth-SA worksheet also values the price of stock using the Constant Growth Dividend Discount Model and uses Excel Data Tables to perform Sensitivity Analysis on the price of stock by varying the Required Return and Growth rate.

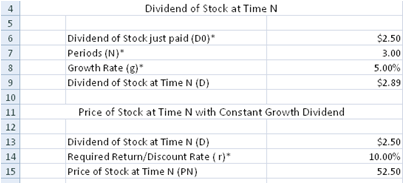
Price of Stock at Time N (Terminal Value)
Historically, it has been found that many companies grow very rapidly in its first few years and then subsequently settling down to a constant growth rate. In this case, to value the price of the stock of a company, we need to consider both the initial hyper growth stage and the subsequent constant growth stage. The constant growth stage is similar to what we have seen in the previous section where we value the price of a constant growth stock. This period where the growth of the company settles down to a constant growth is sometimes known as the Horizon period. The value of the company in the Horizon period is known as the Terminal value.The PriceofStockatN calculates the Terminal value of a stock when the company settles down to a constant growth rate. The calculation of the terminal value is used in many of the spreadsheets in the subsequent sections.
Terminal Value
Terminal Value = (Dividend of Stock at Time N *(1+Growth Rate))/(Required Return-Growth Rate)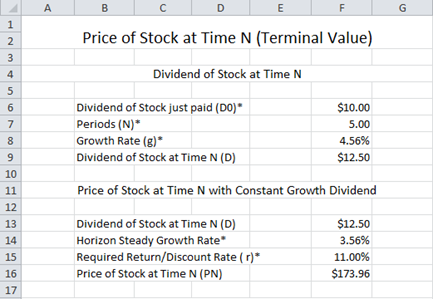
The PriceofStockatN-SA calculates the Terminal value of a stock and uses Excel Data Tables to perform Sensitivity Analysis on the price of the stock by varying the Required Return and Growth rate.

Price of Stock with Two Stage Growth Dividends
From the previous section, we have mentioned that many companies initially grow very rapidly in its first few years and then subsequently settling down to a constant growth rate. In this case, to value the price of the stock of a company, we need to consider both the initial hyper growth stage and the subsequent constant growth stage.To value the stock price of a company with non-constant growth, we can consider the following formula:
Stock Price = Sum of Present values of Dividends in first stage High Constant Growth Period + Terminal Value
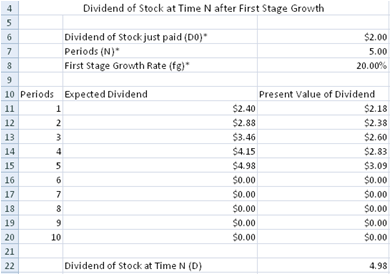
The PriceofStock-TwoStageGrowth worksheet calculates the price of a stock based on the above formula. The worksheet is separated into two sections. The first section calculates the 'Sum of Present values of Dividends in first stage High Constant Growth Period' and the second calculates the Terminal Value.
Sum of Present values of Dividends in first stage High Constant Growth Period
The Expected Dividend is calculated based on the following formula:Expected Dividend at Period X+1 = Dividend of Stock at Period X * (1 + Growth Rate)
Terminal Value
Terminal Value = (Dividend of Stock at Time N *(1+Growth Rate))/(Required Return-Growth Rate)
Sensitivity Analysis
The PriceofStock-TwoStageGrowth-SA worksheet calculates the price of a stock with non-constant growth dividends and performs a Sensitivity Analysis by varying the Required Return and Growth rate.Price of Stock with Non-Constant Growth Dividends
This worksheet is similar to the one calculating the Price of Stock with Two Stage Growth Dividends. It values the stock price based on the following formula:Stock Price = Sum of Present values of Dividends in Non-Constant Growth Period + Terminal Value
Sum of Present values of Dividends in Non Constant Growth Period
The 'Sum of Present values of Dividends in Non Constant Growth Period' section allows you to key in Expected Dividends instead of projecting the dividends using a growth rate.
Terminal Value
Terminal Value = (Dividend of Stock at Time N *(1+Growth Rate))/(Required Return-Growth Rate)