Average Directional Movement Index
Directional Movement Indicator
Positive Directional Movement Indicator is the ratio of the Average Positive Directional Movement to the Average True Range. Negative Directional Movement Indicator is the ratio of the Average Negative Directional Movement to the Average True Range. Thus whichever Directional Movement Indicator is larger; it will mean that the trend of the price is in the direction.First we must calculate the Wilder’s Average for both the Positive Directional Movement (PDM) and Negative Directional Movement (NDM).
Calculating PDM in Excel- Using the Wilders.xls file
Copy the value in the Cell O3 to Cell Q3. This is the first value we used for initializing the Wilder’s Average. Some technical analysts will initialize the first value with a 14 Day Simple Moving Average of the PDM.
Select Cell Q4. Key in “=ROUND((Q3*13+O4)/14,2)”.
Drag this cell downwards to the end of the Stock Prices. This will give us the Wilder’s Average Positive Directional Movement. For Excel 2003, copy this cell (we are actually copying the formula of this cell), drag a range downwards to the last value of the Stock Prices, and paste it.
Click on Cell Q1 and type in “Wilder’s Average PDM”
Calculating NDM in Excel
Copy the value in the Cell P3 to Cell R3. This is the first value we used for initializing the Wilder’s Average. Some technical analysts will initialize the first value with a 14 Day Simple Moving Average of the NDM.
Select Cell R4. Key in “=ROUND((R3*13+P4)/14,2)”.
Drag this cell downwards to the end of the Stock Prices. This will give us the Wilder’s Average Positive Directional Movement. For Excel 2003, copy this cell (we are actually copying the formula of this cell), drag a range downwards to the last value of the Stock Prices, and paste it.
Click on Cell R1 and type in “Wilder’s Average NDM”
If you chart the Wilder’s NDM with Wilder’s Average NDM, the following is what you will get.
Positive/Negative Directional Movement Indicator
Click on the Cell S3.Key in “=ROUND((Q3/N3)*100,2)”.
Drag this cell downwards to the end of the Stock Prices. This will give us the Positive Directional Movement Indicator. For Excel 2003, copy this cell (we are actually copying the formula of this cell), drag a range downwards to the last value of the Stock Prices, and paste it.
Click on Cell S1 and type in “Positive DMI”
Click on the Cell T3.
Key in “=ROUND((R3/N3)*100,2)”.
Drag this cell downwards to the end of the Stock Prices. This will give us the Negative Directional Movement Indicator. For Excel 2003, copy this cell (we are actually copying the formula of this cell), drag a range downwards to the last value of the Stock Prices, and paste it.
Click on Cell T1 and type in “Negative DMI”
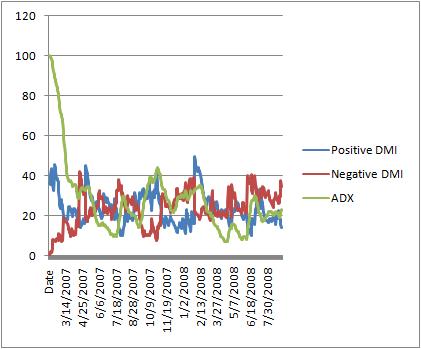
Chart out the Positive DMI, Negative DMI and the Closing Price. Use it to analyze trends observed and published by the different Technical Traders or by Wilder himself.
Average Directional Movement Index
Directional Index (DX) is calculated as the ratio of the absolute difference between the values of the two Directional Movement Indicators to the sum of the two Directional Movement Indicators. This allows us to measure the strength of a trend. The DX will be a larger value when the price is moving towards one direction. The Average DX can be calculated using Wilder's Moving Average. This allows the fluctuations in the Directional Index to be reduced.Click on the Cell U3.
Key in “=ROUND((ABS(S3-T3)/(S3+T3))*100,2)”.
Drag this cell downwards to the end of the Stock Prices. This will give us the Directional Movement Index. For Excel 2003, copy this cell (we are actually copying the formula of this cell), drag a range downwards to the last value of the Stock Prices, and paste it.
Click on Cell U1 and type in “DX”
Copy the value on Cell U3 to the Cell V3. This value is used to initialize our Wilder’s Average. Some technical analysts will initialize the first value with a 14 Day Simple Moving Average of the Directional Movement Index.
Click on Cell V4 and key in “=ROUND((V3*13+U4)/14,2)”. This will give us the Wilder’s Average of DX. For Excel 2003, copy this cell (we are actually copying the formula of this cell), drag a range downwards to the last value of the Stock Prices, and paste it.
Drag this cell downwards to the end of the Stock Prices. This will give us the Average Directional Movement Index.
Click on Cell V1 and type in “ADX”

We now have three very useful indicators, the Positive DMI, Negative DMI and Average Directional Index (ADX). If the Positive Directional Movement Indicator crossover above the Negative Directional Movement Indicator, it meant that the price is on the upward trend, whereas when the Positive Directional Movement Indicator crossover below the Negative Directional Movement Indicator, it meant the price is on the downward trend. The Average Directional Index is used to indicate how strongly the price is moving towards one direction. So if the chart shows Average Directional Index increasing, it means the price is increasing in trend in a particular direction indicated by the Positive Directional Movement Indicator or Negative Directional Movement Indicator (whichever is larger).
Back to Automated Stock Trading Main Page
