Moving Average
Many successful investors and traders make use of trends to profit from the market, and Moving Average is one of the most important methods for identifying market trends. The stock prices for successive periods are used for the calculation of a moving average. Moving average reduces the effects of short term volatility and allows the investors or traders to see the underlying trends of a market.The aim of this section is to allow you to calculate simple moving average using Excel and make use of Moving Average Crossover to determine buy / sell signal and resistance level in a stock. After that, the simple moving average will be expanded with Welles Wilder method of moving average, Directional Movement and Average Directional Movement Indicators. Welles Wilder is the founding father who had introduced many of the modern trend concepts in his book New Concepts in Technical Trading System.
Simple Moving Average
A moving average reduces the effect short term price volatility. For example, a 10 day simple moving average of the closing price is calculated by averaging the closing price of the last 10 days.Simple Moving Average = Sum(Closing Price of Last 10 Days)/10
Applying this simple concept, let's go to our Excel file to calculate the following
· 10 Day Moving Average
· 14 Day Moving Average
· 20 Day Moving Average
· 30 Day Moving Average
10 Days Moving Average
Open the AutomatedDownloadData.xls in Excel. Save it as a new workbook call it MovingAverage.xls. Run the Download macro if the data has not yet been downloaded. Remember to sort the data based on Date from Oldest to Newest (or in Ascending order for Excel 2003).Next, we are going to calculate a 10 Day Moving Average. Follow the steps below:
1. Click on the Cell H11.
2. Type in “=ROUND(AVERAGE(E2:E11),2)”. This will calculate the average (of ten values of the closing price) from row 2 to row 11 of column E and round them to 2 decimal places.
3. Drag this cell downwards to the end of the Stock Prices. For Excel 2003, copy this cell (we are actually copying the formula of this cell) drag a range downwards to the last value of the Stock Prices, and paste it.
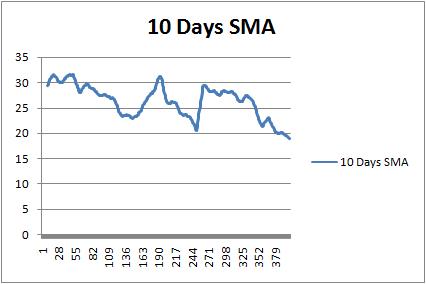
4. Go to Cell H1, and type in “10 Day SMA”
Charting the Moving Average
Select the 10 Days SMA column andExcel 2003: Go to Insert->Chart, and select Line as the Standard Types, and click the Next button repeatedly until the dialog closes.
Excel 2007: Go to Insert->Line. Choose the first line graph. You will be getting a graph like below.
You will be able to change the X-Axis to date. We will leave that as an Exercise for you.
Using the Moving Average
Compare a 10 day versus a 20 day moving average. One uses 10 values to compute the average while the other uses 20 values.A 20 day moving average gives you less fluctuation and sees the underlying trend more clearly. However it does not mean that the 20 day average is better. Imagine that you are going to calculate the moving average for a new day, the 20 day moving average includes more values in its averaging, and thus, might be slower to respond to changes compared to the 10 day one. So if a trend is reversing, you will be able to see it faster in the 10 day moving average. However, sometimes, the reverse trends in the 10 days moving average might be a false signal.
If you overlap the different moving averages in a single graph, notice
· A support level usually occurs when two moving averages cross / intersects each other.
· When the shorter (faster changing) moving average crosses above the longer (slower changing) one, it usually means a rising trend of the prices.
· When the shorter (faster changing) moving average crosses below the longer (slower changing) one, it usually means a declining trend of the prices.
· Moving average is actually a mean of the price, thus when the actual price deviates too far from its moving average, it will typically start moving back (tends) towards the moving average.
Wilders Moving Average
A new trading day simple moving average is calculated by dropping off the earliest trading day's price. This can cause a problem if the recent price data shows little changes. This is not acceptable to some traders or analysts. On the other hand, it is also often argued that the recent prices are often the most important in identifying trends.Wilders devised a simple mechanism to overcome the above problem. This is done by taking into account previous days moving average and also placing more weight on the recent prices.
Launch Excel and load the MovingAverage.xls workbook. Remove the charts and save the workbook as Wilders.xls.
Wilder's Current Day Moving Average = (Previous Day Wilder's Moving Average * (n-1) + Current Day Price)/n
We are going to calculate a 14 Days Wilder’s Moving Average.
1. Copy the value from Cell I15 to the Cell L15. We are initializing the first Wilder’s Moving Average with the value of a Simple Moving Average.
2. Click on Cell L16. Type in “=ROUND((L15*13+E15)/14,2)”.
3. Drag Cell L16 downwards to the end of the Stock Prices. For Excel 2003, copy this cell (we are actually copying the formula of this cell), drag a range downwards to the last value of the Stock Prices, and paste it.
4. Go to Cell L1, type in “Wilder’s MA”
Back to Automated Stock Trading Main Page