Technical Analysis Add-In
Analysis Add-In Setup
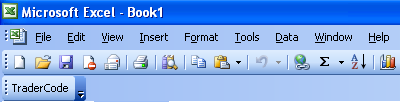
During the installation of TraderCode, the Analysis Add-In and formulas will be automatically setup in Microsoft Excel. It is very simple and straight forward to use the Add-In to create technical indicators for analysis.In Excel 2003, a new toolbar will be inserted into the workbook after installation.
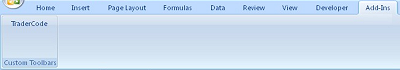
In Excel 2007, select the Add-In tab, the TraderCode command button will be located in this tab.
To follow this tutorial, you can first can launch Microsoft Excel from the Windows Start Menu and prepare the stock data where the Date, Open, High, Low, Close, Volume columns are adjacent to each other.
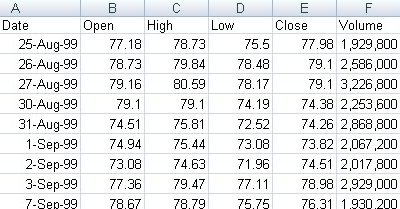
This can usually be done by downloading the data directly from financial websites (such as Google Finance or Yahoo! Finance). Refer to the document on "How to Download Stock Data to Excel" for more information or simply launch the TraderCode.xls spreadsheet which comes with pre-setup data.
Step by Step Tutorial
To start the Add-In, click on the TraderCode button as described above. The Add-In main dialog lets you choose an indicator to compute. Simply select a range to apply the computation, and select an output column to place the results.Steps for Using the Add-In
1. Select a Technical Indicator to compute. For example, the screen below shows the Simple Moving Average being selected.
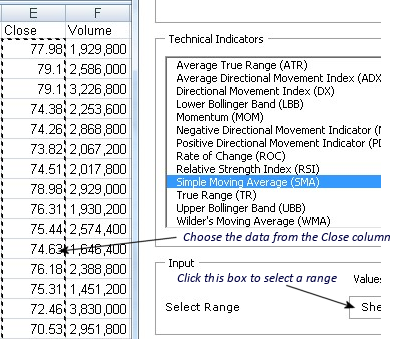
2. Click the Select Range box and choose a range in the Excel worksheet shown below. Depending on the indicator chosen, the input can be a range from single column or multiple columns. For our Simple Moving Average (SMA) example, we choose the data from the Close column.
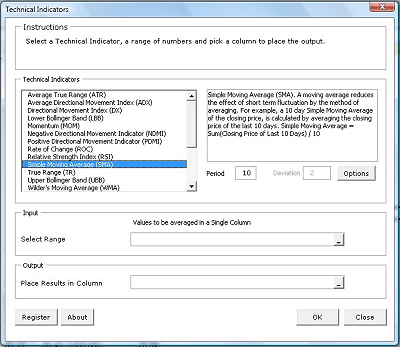
3. The Period indicates the number of values used to compute the Moving Average. We will use the default value 10.
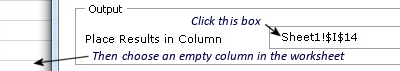
4. Click the Place Results in Column box and choose an empty column in the worksheet to place the results.
5. Click the OK button in the ain dialog box to start calculating the indicator values.
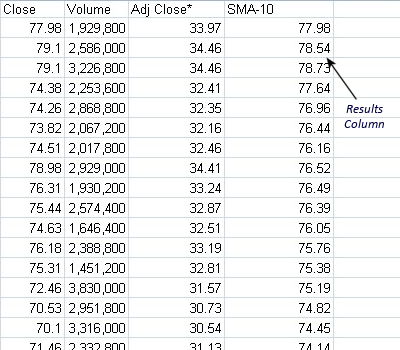
6. You will see the results in the column you have chosen.
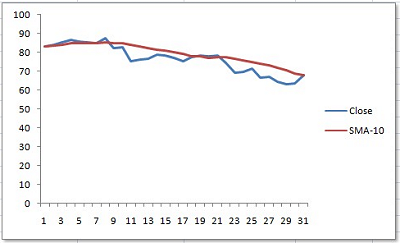
7. You can now proceed to plot the results in Excel by selecting the Close column and the SMA-10 column and choose Insert->Line in Excel 2007 (or Insert->Chart (Line) in Excel 2003). You will be able to see a graph something as follows.
Options Dialog
The Options Dialog contains some of the generic options that apply to all the technical indicators.- Number of Decimal Points - The number of decimal points to round the values of the technical indicators generated.
- Direction of Calculation - Stock prices downloaded from the internet can be sorted from Oldest to Latest in a Top to Bottom manner, or Latest to Oldest in a Bottom to Top manner. This option indicates whether to calculate the technical indicators from Top to Bottom or Bottom to Top. The default is Top to Bottom.
Back to TraderCode Technical Indicators and Technical Analysis Software